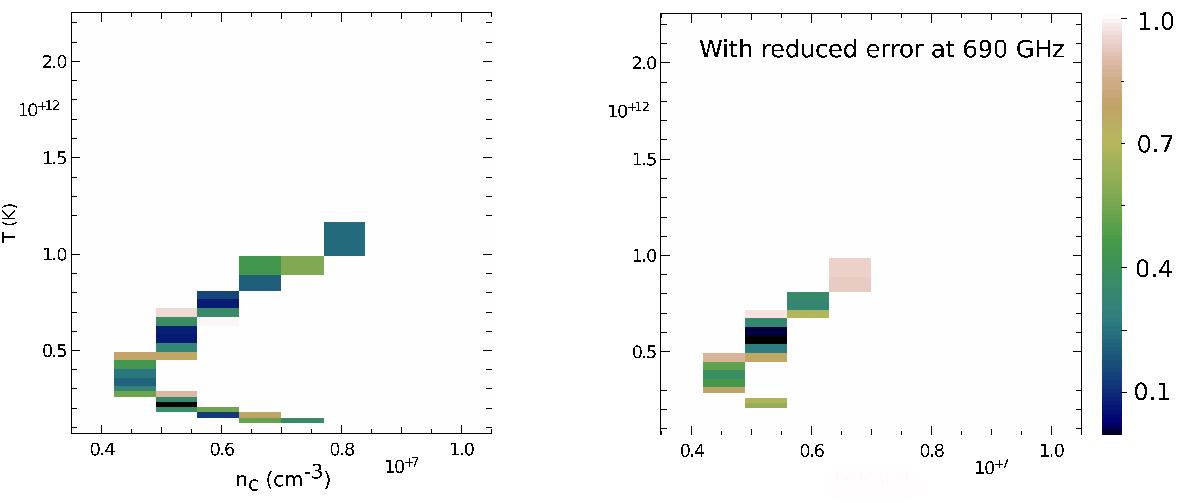
Fig. 4

![]() distribution in the (nc,Tc) plane, for the a = 0, i = 85° fit. All values of
distribution in the (nc,Tc) plane, for the a = 0, i = 85° fit. All values of ![]() bigger than 1 have been put to a high value and appear in white color in this plane to focus on the relevant configurations with
bigger than 1 have been put to a high value and appear in white color in this plane to focus on the relevant configurations with ![]() . Left: using the error bar at 690 Hz used in the fitting routine. Right: reducing the 690 GHz error by a factor of 3: the region with
. Left: using the error bar at 690 Hz used in the fitting routine. Right: reducing the 690 GHz error by a factor of 3: the region with ![]() immediately shrinks. We note that the best-fit temperature changes, while the best-fit density remains the same.
immediately shrinks. We note that the best-fit temperature changes, while the best-fit density remains the same.
Current usage metrics show cumulative count of Article Views (full-text article views including HTML views, PDF and ePub downloads, according to the available data) and Abstracts Views on Vision4Press platform.
Data correspond to usage on the plateform after 2015. The current usage metrics is available 48-96 hours after online publication and is updated daily on week days.
Initial download of the metrics may take a while.


