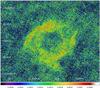
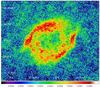
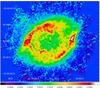
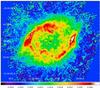
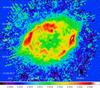
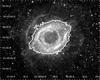
Fig. 1
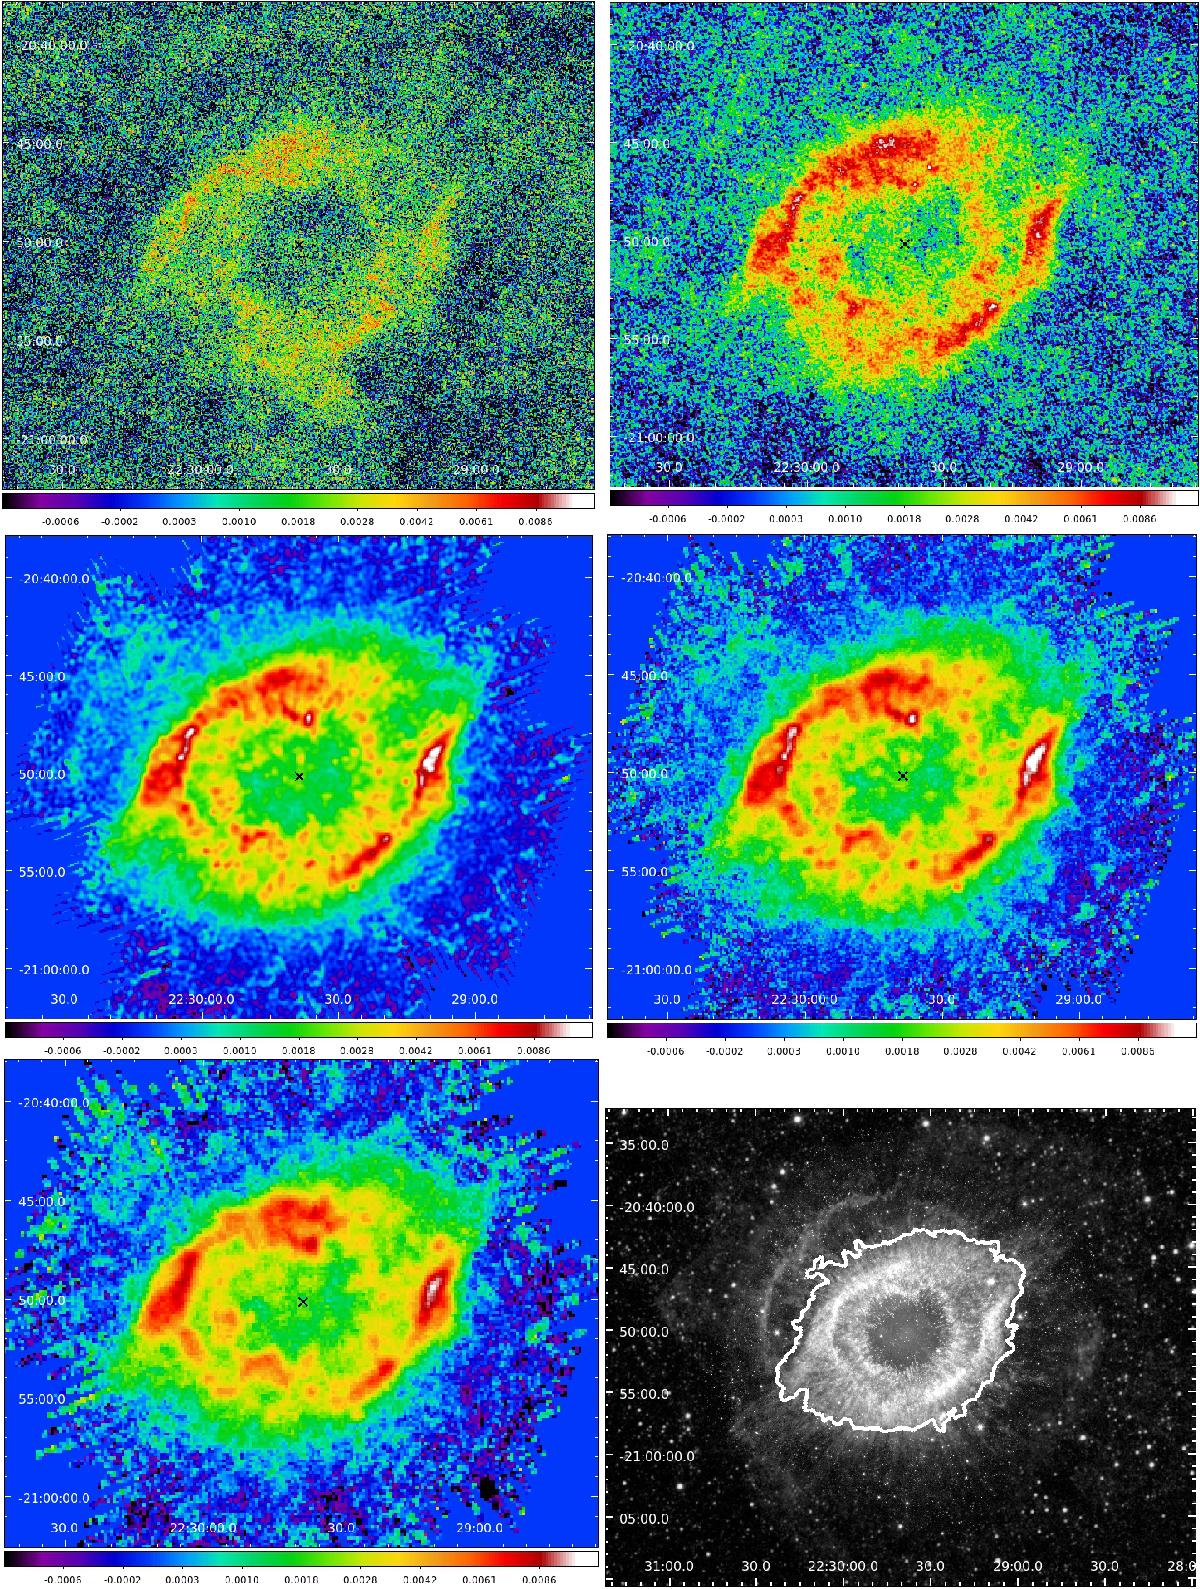
Herschel images of NGC 7293. Top row left to right: PACS 70 and PACS 160 μm images, second row: SPIRE 250 and SPIRE 350 μm images, and bottom row: SPIRE 500 μm and a NASA/JPL-Caltech composite image. The colorbar under the Herschel images shows the flux density in Jy/pixel. The grayscale image is the NASA/JPL-Caltech composite image (pia15817.html) including infrared data from Spitzer wavelengths 3.6 to 4.5 μm and 8 to 24 μm, WISE data at 3.4 to 4.5 and 12 to 22 μm, and ultraviolet data from GALEX at 0.15 to 2.3 μm. The region observed by Herschel and considered in this paper is indicated by the white contour in this last image.
Current usage metrics show cumulative count of Article Views (full-text article views including HTML views, PDF and ePub downloads, according to the available data) and Abstracts Views on Vision4Press platform.
Data correspond to usage on the plateform after 2015. The current usage metrics is available 48-96 hours after online publication and is updated daily on week days.
Initial download of the metrics may take a while.