Fig. 6
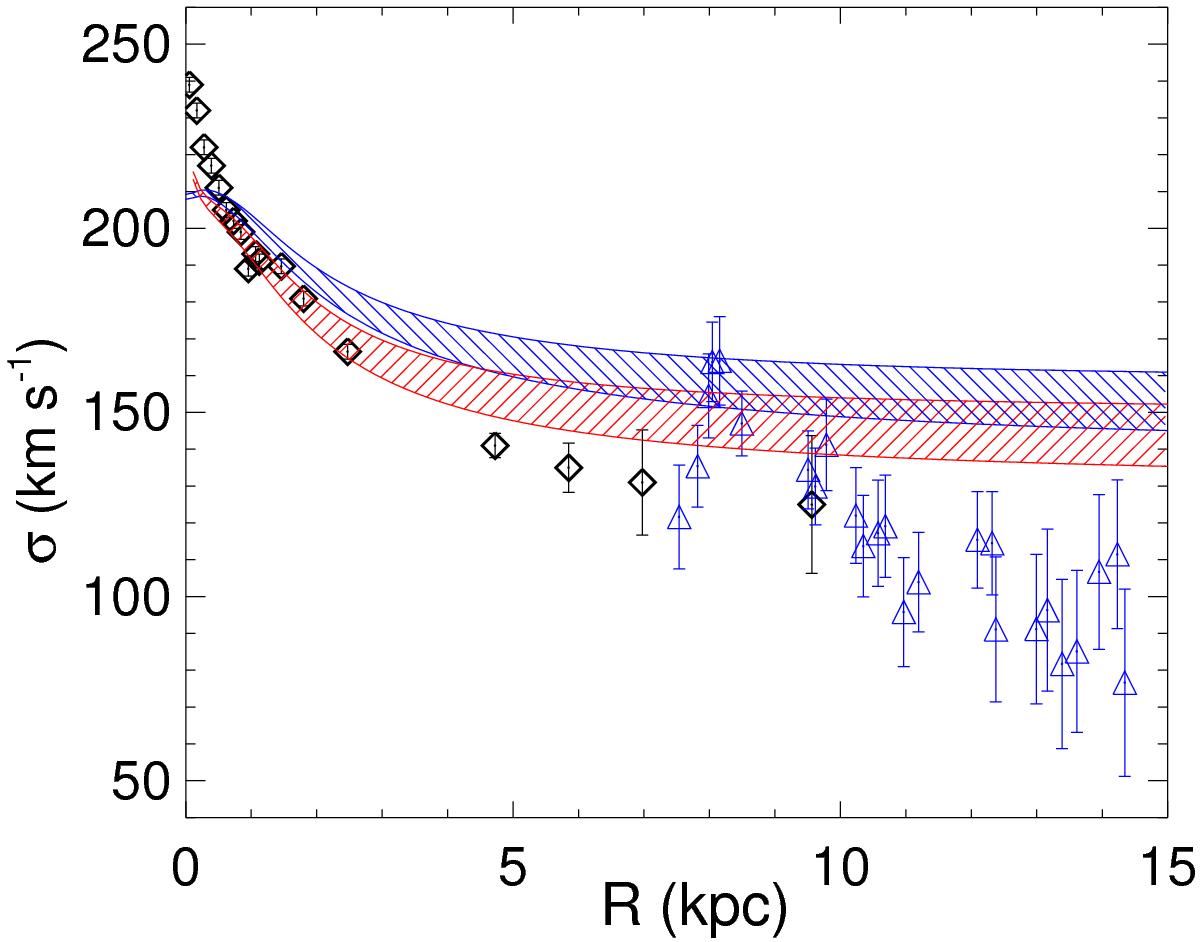
MOND models. As in Fig. 5, black diamonds are the measurements from S12, while blue triangles are the velocity dispersions from the current work. The blue hatched area covers isotropic models with the range of a0 values discussed in the text, while the red area represents the same range for a0 but under the Mamon & Łokas (2005) anisotropy profile.
Current usage metrics show cumulative count of Article Views (full-text article views including HTML views, PDF and ePub downloads, according to the available data) and Abstracts Views on Vision4Press platform.
Data correspond to usage on the plateform after 2015. The current usage metrics is available 48-96 hours after online publication and is updated daily on week days.
Initial download of the metrics may take a while.