Fig. 5
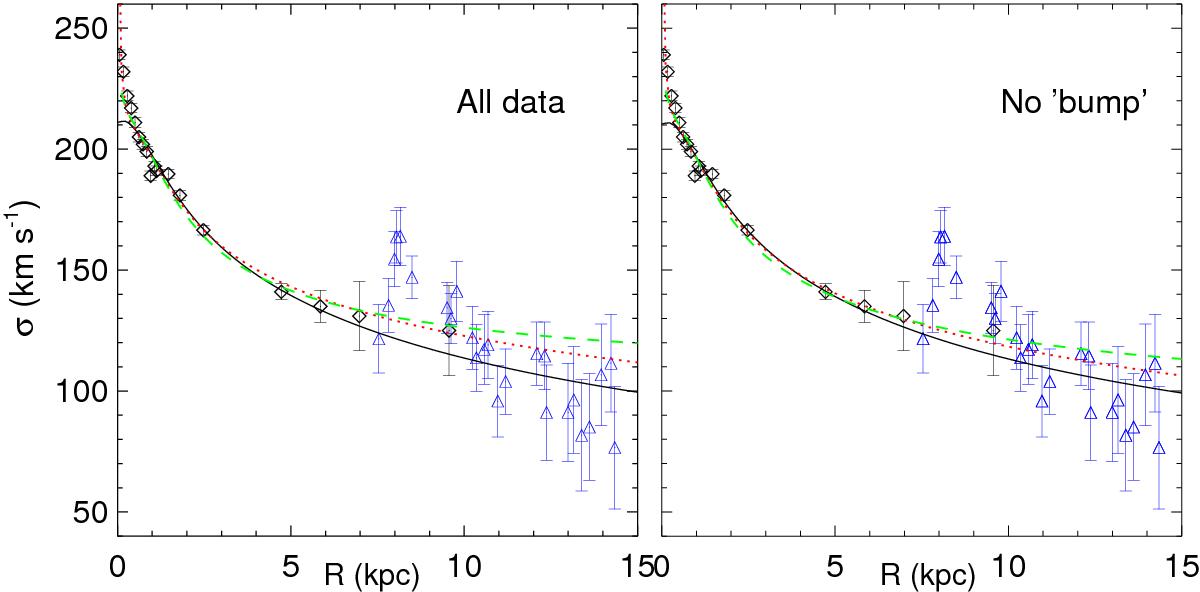
Dynamical models. Black open diamonds are the measurements from S12, while blue triangles are the velocity dispersions from the current work. Left panel: models which consider all the velocity dispersion points. The solid black curve is the stars-only model. The red dotted curve is the best-fitting model with β = 0.3 and NFW halo with c = 10. The green dashed curve is the model under the anisotropy by Mamon & Łokas (2005) allowing the maximum amount of dark mater. Right panel: same as in left panel, but excluding the velocity dispersion between 70′′<R< 80′′ when performing the fits.
Current usage metrics show cumulative count of Article Views (full-text article views including HTML views, PDF and ePub downloads, according to the available data) and Abstracts Views on Vision4Press platform.
Data correspond to usage on the plateform after 2015. The current usage metrics is available 48-96 hours after online publication and is updated daily on week days.
Initial download of the metrics may take a while.