Fig. 2
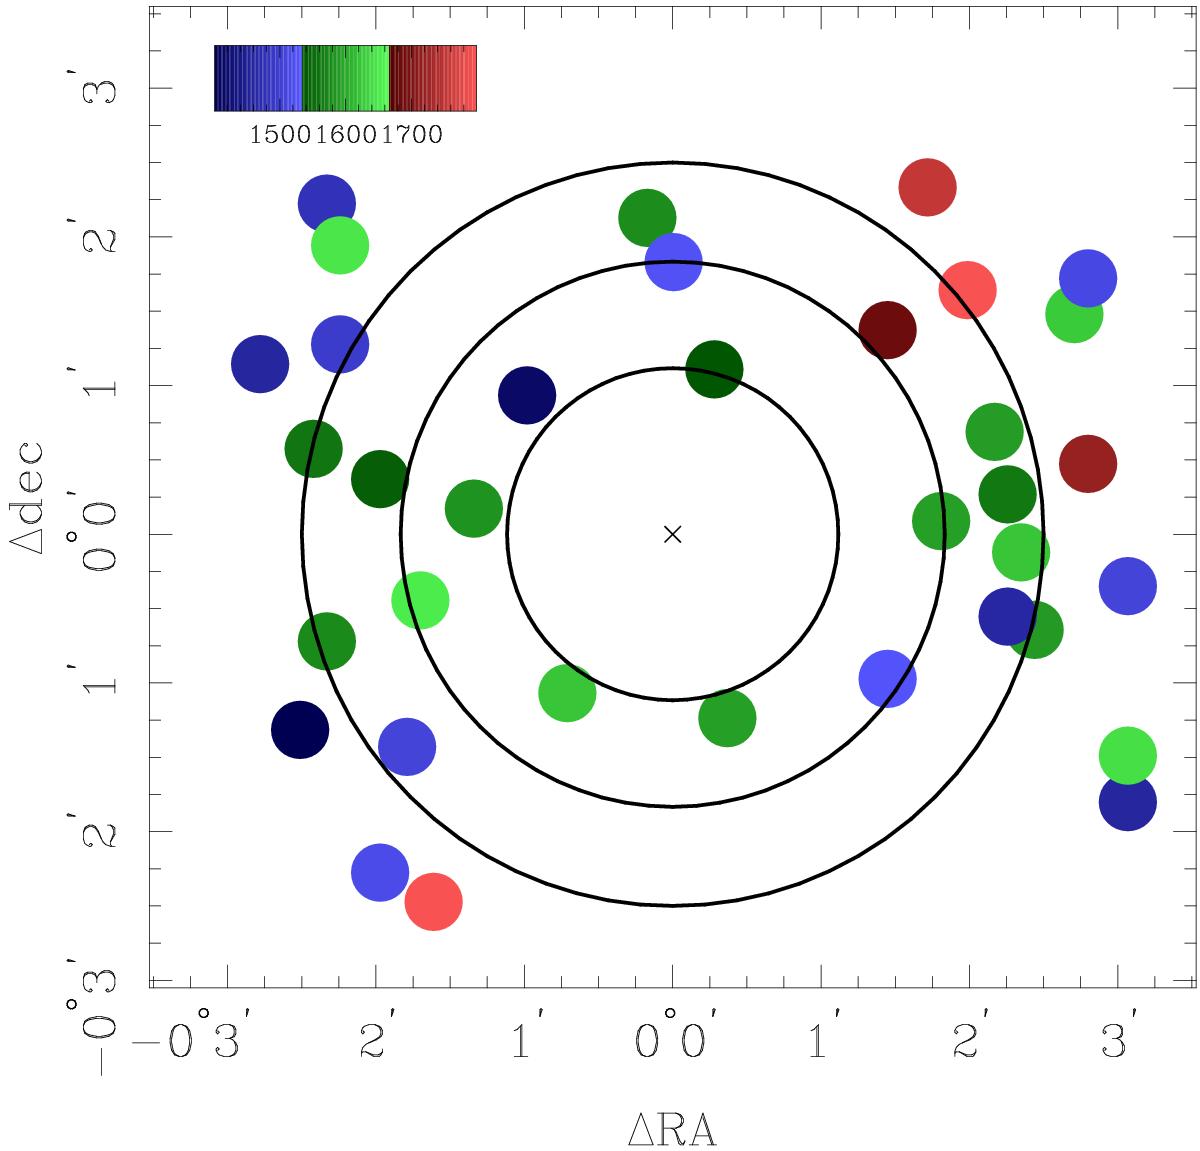
Velocities of the 36 individual slits with good velocity estimates. The individual spectra are plotted as large coloured points with colours representing their velocities. The legend at the top left is given is km s-1. The orientation has been chosen to correspond to that of Fig. 1, so that north is down and east is to the left. Large circles delineate the bin edges used in Fig. 3 at 67′′, 110′′ and 150′′.
Current usage metrics show cumulative count of Article Views (full-text article views including HTML views, PDF and ePub downloads, according to the available data) and Abstracts Views on Vision4Press platform.
Data correspond to usage on the plateform after 2015. The current usage metrics is available 48-96 hours after online publication and is updated daily on week days.
Initial download of the metrics may take a while.