Free Access
Fig. 7
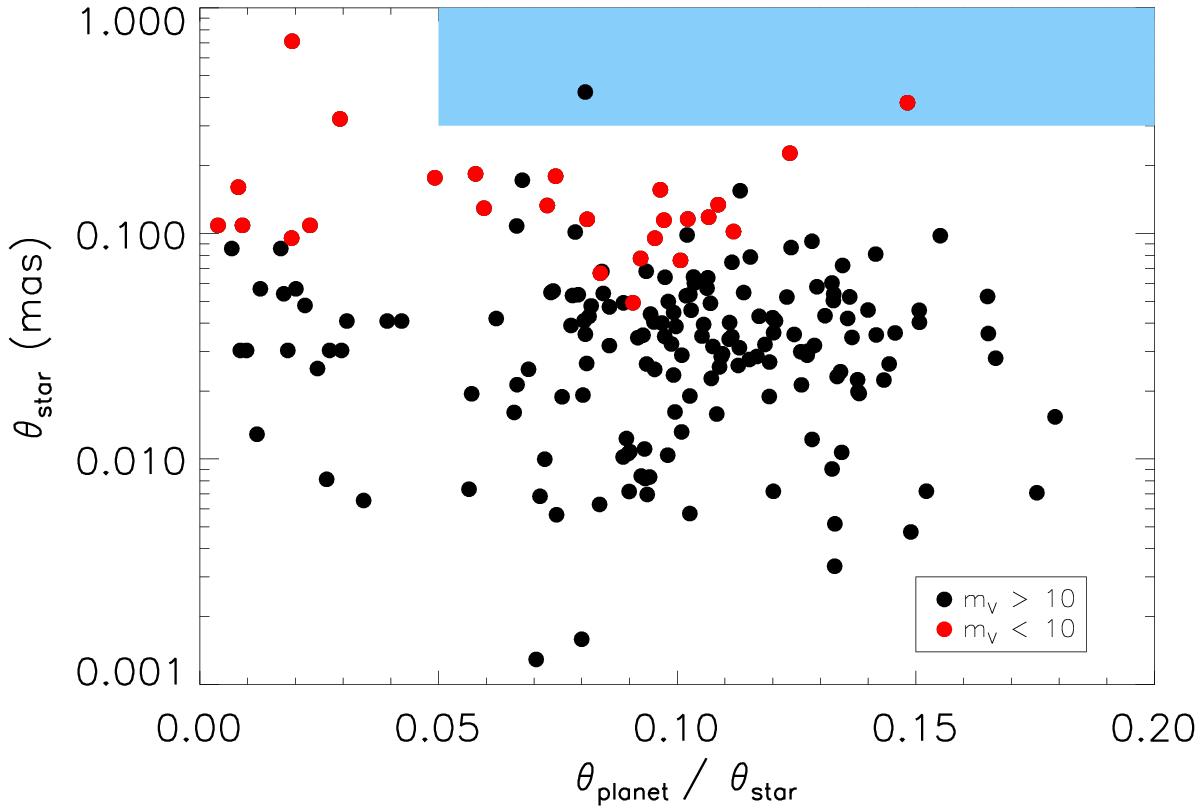
Transiting exoplanet host stars with available distance and radius that allow deriving their angular diameter. They are plotted according to the ratio θp/θ⋆. Stars with mV< 10 are plotted in red and those with mV> 10 in black. The blue box represents the detecting ability of VEGA.
Current usage metrics show cumulative count of Article Views (full-text article views including HTML views, PDF and ePub downloads, according to the available data) and Abstracts Views on Vision4Press platform.
Data correspond to usage on the plateform after 2015. The current usage metrics is available 48-96 hours after online publication and is updated daily on week days.
Initial download of the metrics may take a while.