Fig. 6
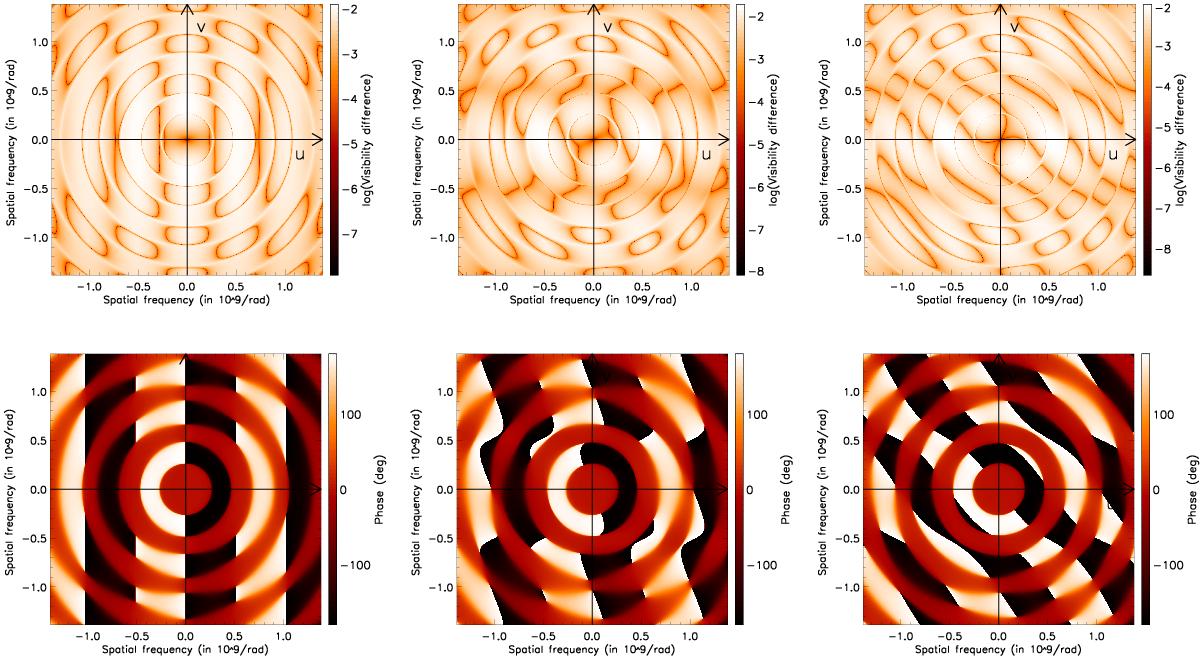
Map of the signal induced by an exoplanet at (0.2,0.0) mas and a spot at (0.2,0.2) mas in the visibility modulus (log scale, upper panels) and the phases (bottom panels), for a 1 mas star. Left: exoplanet alone with θp = 0.10 mas. Middle: exoplanet of diameter θp = 0.10 mas with a spot of diameter θs = 0.10 mas. Right: same as middle with θp = 0.05 mas.
Current usage metrics show cumulative count of Article Views (full-text article views including HTML views, PDF and ePub downloads, according to the available data) and Abstracts Views on Vision4Press platform.
Data correspond to usage on the plateform after 2015. The current usage metrics is available 48-96 hours after online publication and is updated daily on week days.
Initial download of the metrics may take a while.