Fig. 4
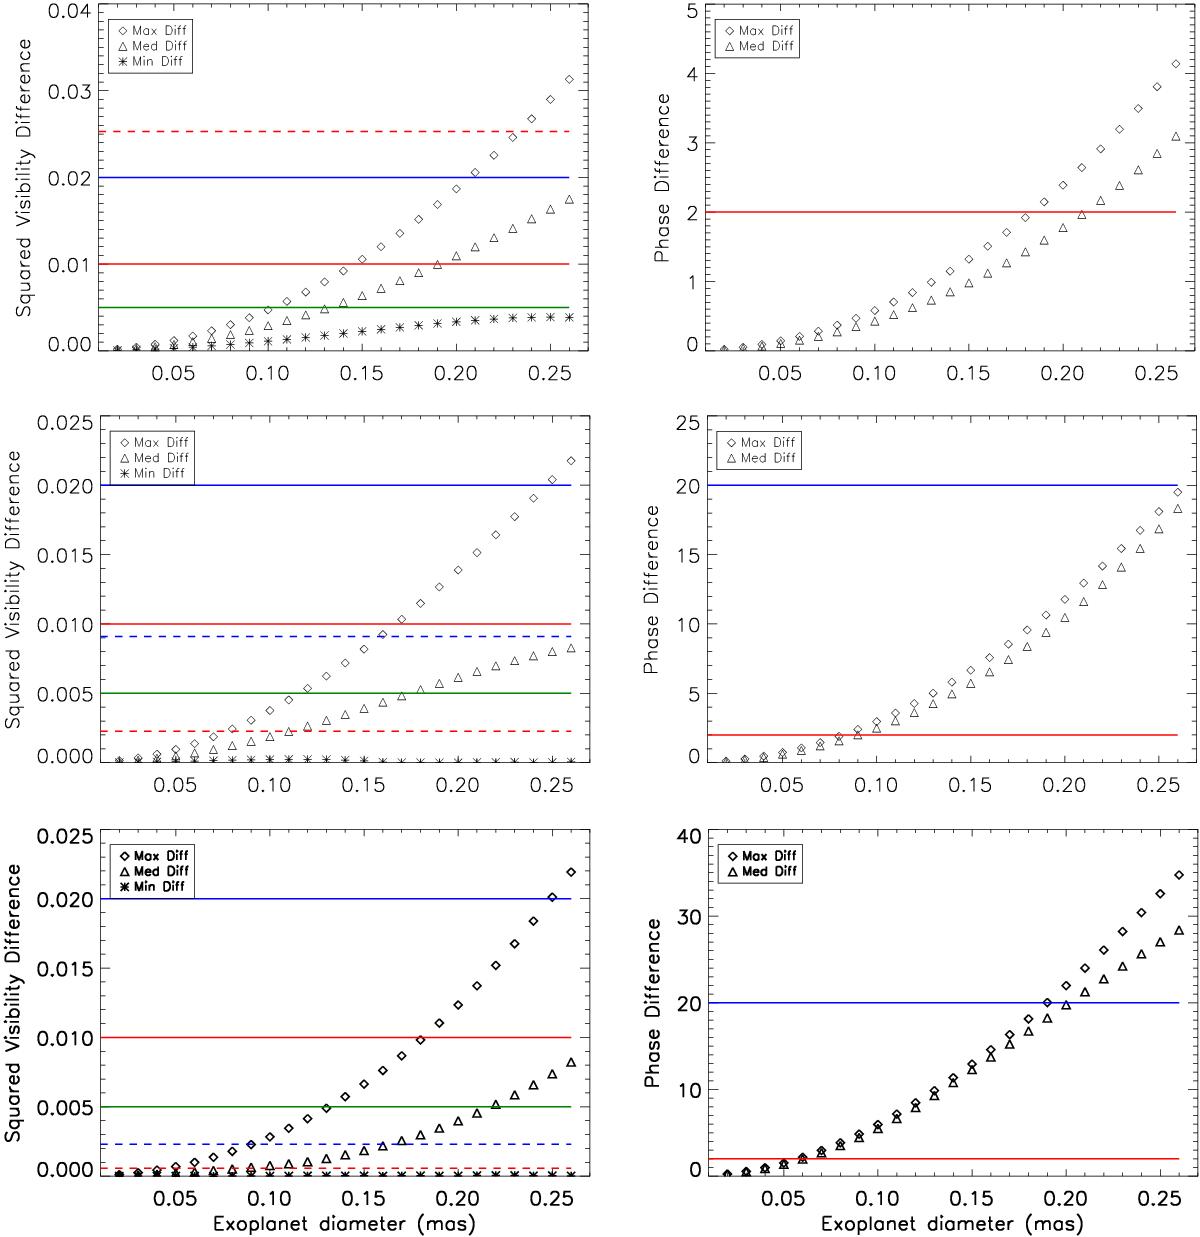
Squared visibility and phase differences between a 1 mas star with a transiting exoplanet at (0.2,0.0) mas and a single star at different spatial frequencies (1.1 × 10⁸ (1/rad), top; 2.1 × 10⁸ (1/rad), middle; 3.4 × 10⁸ (1/rad), bottom). Squared visibilities: solid lines: absolute errors (1%, red; 2%, blue; 0.5%, green). Dashed lines: errors corresponding to different S/N: 5 (blue) and 20 (red). Phases (in degree): 2° (red) and 20° (blue).
Current usage metrics show cumulative count of Article Views (full-text article views including HTML views, PDF and ePub downloads, according to the available data) and Abstracts Views on Vision4Press platform.
Data correspond to usage on the plateform after 2015. The current usage metrics is available 48-96 hours after online publication and is updated daily on week days.
Initial download of the metrics may take a while.