Fig. 8
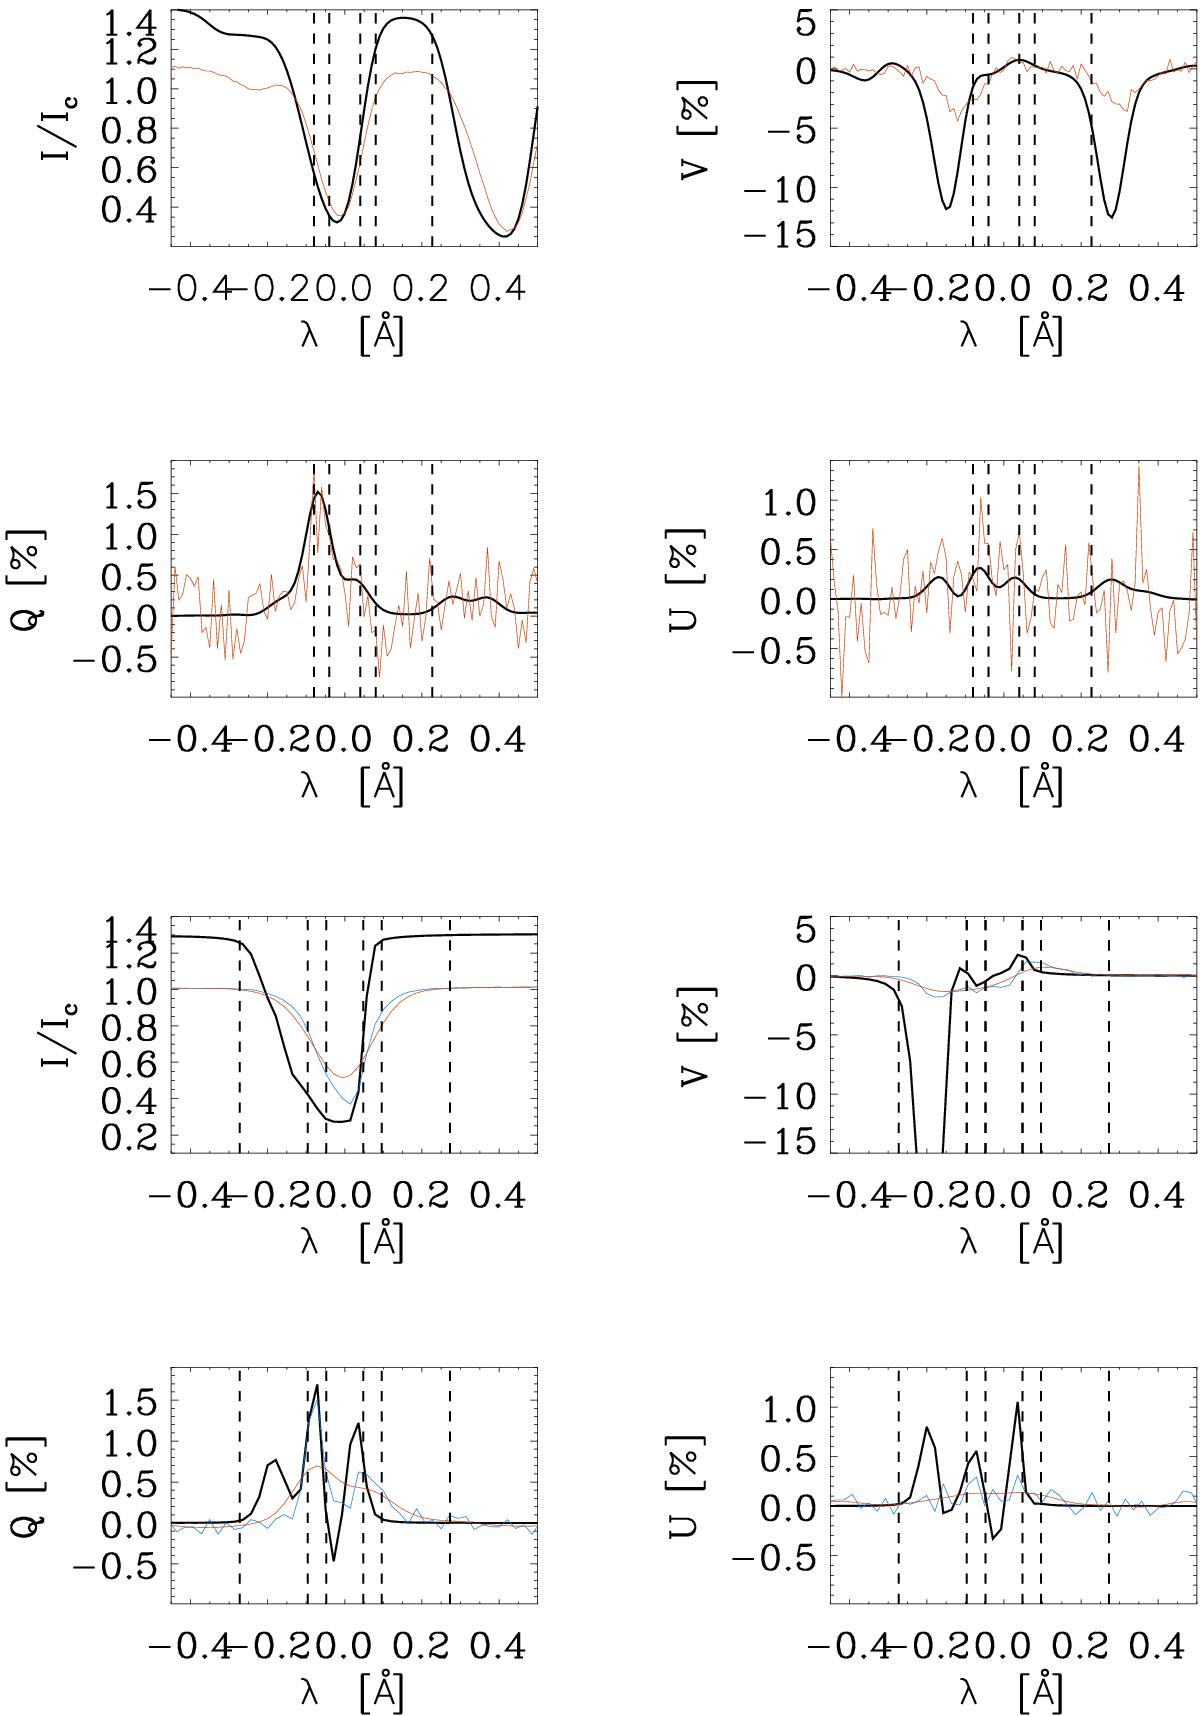
Example of a feature that appears on a granular edge in the emergence run at t = 156 s. Resulting Stokes I, Q, U and V profiles at the pixel shown in Fig. 7. Upper panels: synthesised IMaX observations at the original resolution (black line) and for the diffraction-limited resolution, stray-light and noise are taken into account (red line); lower panels: synthesised Hinode observations, the Fe I 630.25 nm at the original spatial resolution (black), at the spatial resolution of Hinode (blue), and with the spectral resolution of IMaX (red).
Current usage metrics show cumulative count of Article Views (full-text article views including HTML views, PDF and ePub downloads, according to the available data) and Abstracts Views on Vision4Press platform.
Data correspond to usage on the plateform after 2015. The current usage metrics is available 48-96 hours after online publication and is updated daily on week days.
Initial download of the metrics may take a while.