Fig. 6
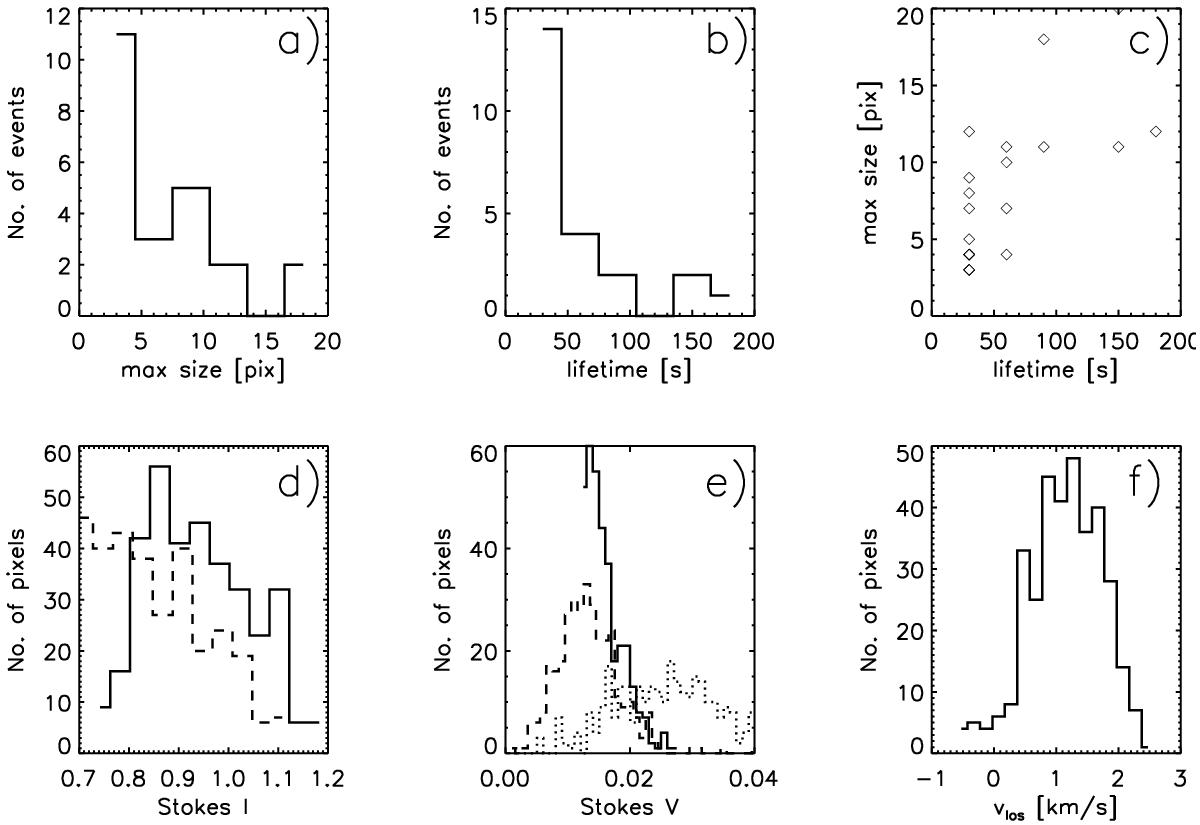
Characteristics of selected simulated events: a) distribution of maximal area, b) lifetimes, c) relations between the area and the lifetime, d) corresponding Stokes I profiles (solid − continuum intensity distribution; dashed − line averaged intensity), e) corresponding Stokes V profiles (solid − Stokes V at Δλ = +227 mÅ; dashed − mean, line-averaged Stokes V; dotted – maximum of Stokes V) and f) line of sight velocity retrieved from Stokes I. The figure is comparable to Fig. 2 from Borrero et al. (2010) which shows the same parameters retrieved from observations.
Current usage metrics show cumulative count of Article Views (full-text article views including HTML views, PDF and ePub downloads, according to the available data) and Abstracts Views on Vision4Press platform.
Data correspond to usage on the plateform after 2015. The current usage metrics is available 48-96 hours after online publication and is updated daily on week days.
Initial download of the metrics may take a while.