Free Access
Fig. 2
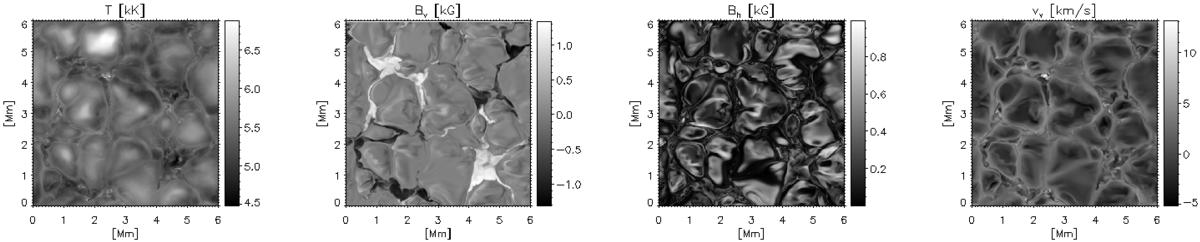
Emergence run at t = 156 s – horizontal cut through the simulation domain (for the evolution of these quantities – see the online movie). Left to right: temperature, vertical, and horizontal field, line-of-sight velocity (upflow is negative) at a constant geometrical height that corresponds to ⟨ τ500 ⟩ ≈ 1.
Current usage metrics show cumulative count of Article Views (full-text article views including HTML views, PDF and ePub downloads, according to the available data) and Abstracts Views on Vision4Press platform.
Data correspond to usage on the plateform after 2015. The current usage metrics is available 48-96 hours after online publication and is updated daily on week days.
Initial download of the metrics may take a while.