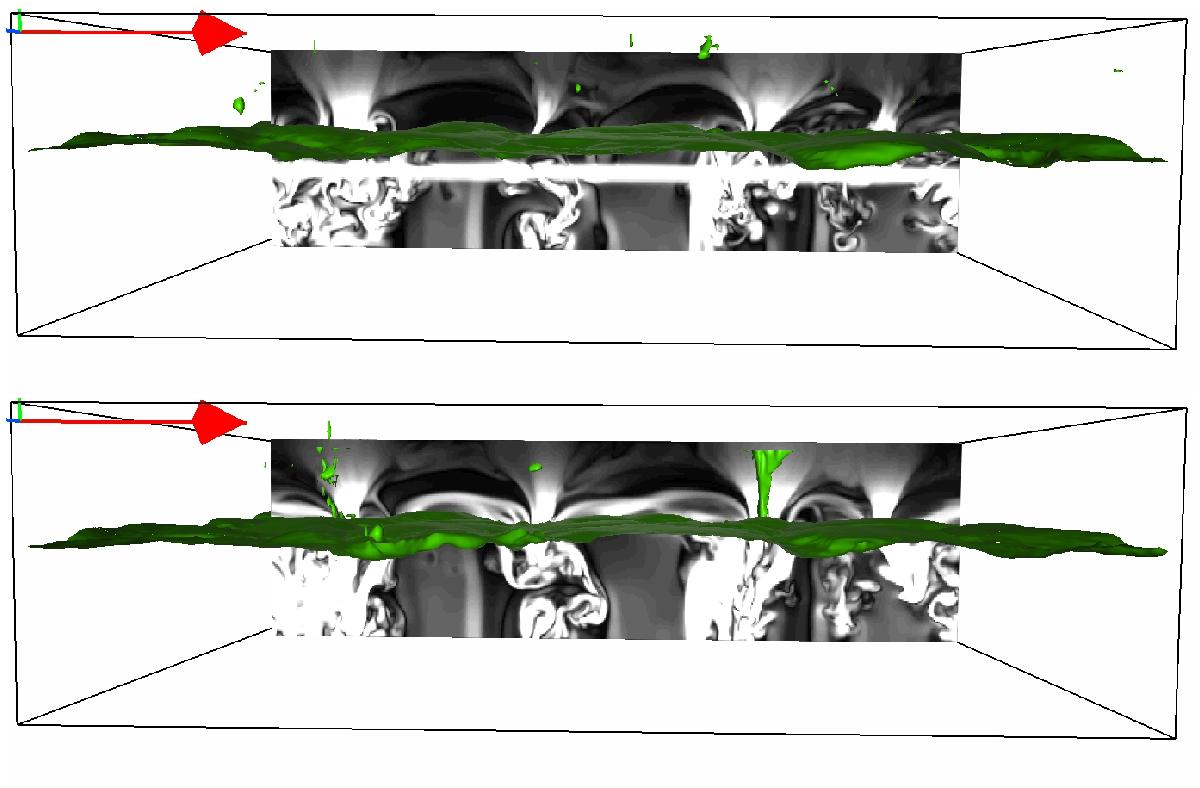
Fig. 1

Two snapshots of the emergence run − side view of the simulation domain at t = 0 s (upper) and t = 188 s. The vertical plane shows the magnetic field strength. The direction of the introduced horizontal field is shown with red arrows (+X direction). The green isosurface of a temperature of 6000 K marks the position of the τ500 ≈ 1 level. Above this corrugated plane, green features are visible that signal hot gas in the upper part of the simulation domain. This is where reconnection takes place or shock fronts are formed.
Current usage metrics show cumulative count of Article Views (full-text article views including HTML views, PDF and ePub downloads, according to the available data) and Abstracts Views on Vision4Press platform.
Data correspond to usage on the plateform after 2015. The current usage metrics is available 48-96 hours after online publication and is updated daily on week days.
Initial download of the metrics may take a while.


