Fig. 7
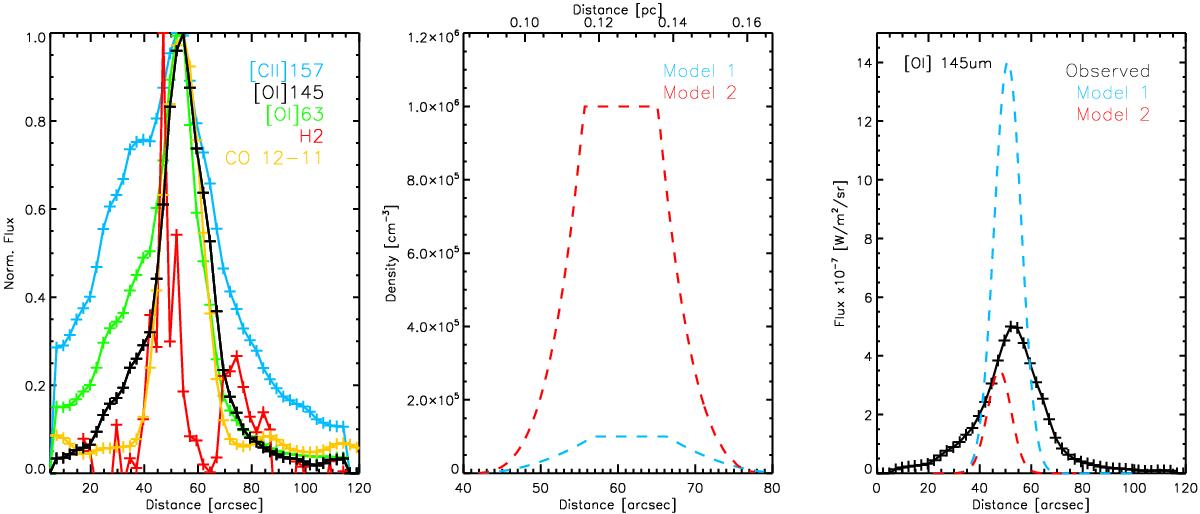
Left panel: observed non-convolved profile of the atomic and molecular lines as a function of the distance to HD 200775 along the cut shown in Fig. 5 and described in Sect. 4. Middle panel: density profiles at two different maximum densities used by Köhler et al. (2014) in their analysis of the molecular emission. Model 1 has a peak gas density of 105, model 2 a density of 106 cm-3. Right panel: observed profile emission of the [O i]145 μm line compared with the convolved predicted emission by Meudon PDR models.
Current usage metrics show cumulative count of Article Views (full-text article views including HTML views, PDF and ePub downloads, according to the available data) and Abstracts Views on Vision4Press platform.
Data correspond to usage on the plateform after 2015. The current usage metrics is available 48-96 hours after online publication and is updated daily on week days.
Initial download of the metrics may take a while.