Fig. 6
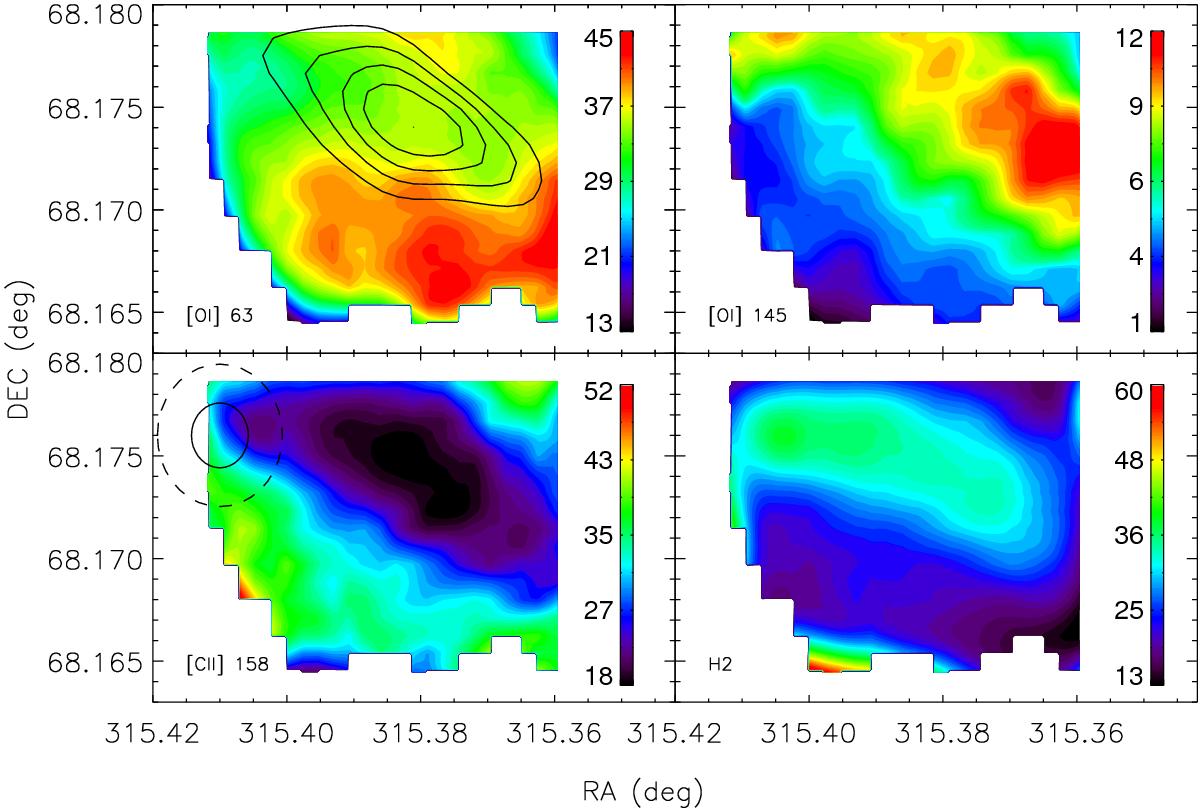
Relative cooling budget of the [O i]63 and 145 μm, [C ii]158 μm lines, and the 0-0 S(1), S(2), S(3) H2 rotational transitions and v = 1–0 S(1) in percentage (%). Adding the contribution of all four species for a given point in the map amounts to 100%. Other species that can contribute to the cooling are ignored in this figure (see Sect. 4). In the first panel we show a contour of the PDR as traced by the [O i]63 μm emission to guide the eye. The images have been convolved to the largest of the beam sizes of these species, in this case the [C ii]158 μm line, shown as a solid circle in the [CII] panel. In addition, and for comparison, we also show the largest CO beam size (25″) used to calculate the cooling budget in Table 1 as a dashed circle.
Current usage metrics show cumulative count of Article Views (full-text article views including HTML views, PDF and ePub downloads, according to the available data) and Abstracts Views on Vision4Press platform.
Data correspond to usage on the plateform after 2015. The current usage metrics is available 48-96 hours after online publication and is updated daily on week days.
Initial download of the metrics may take a while.