Fig. 5
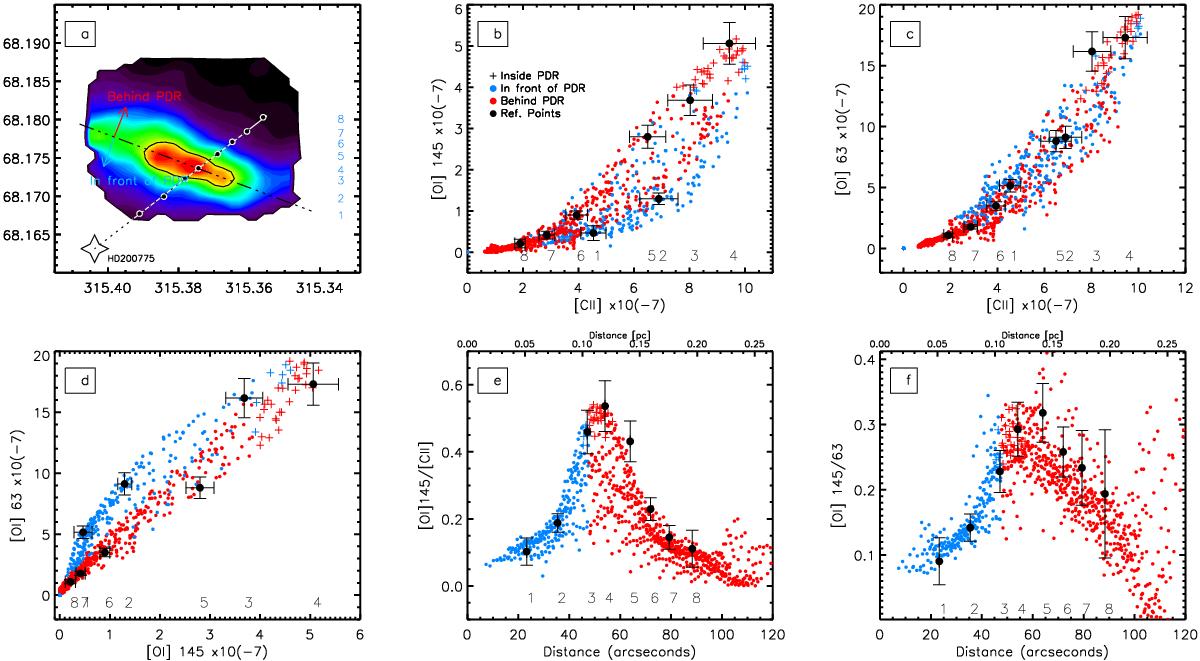
Intensity plots for different combinations of line fluxes (in 10-7 W m-2 sr-1) and line ratios relative to other lines or distance to HD 200775. All fluxes have been convolved to the largest beam (11″). The different regions are indicated in the convolved [O i]145 μm map in the first panel and are labelled in the second, where blue represents points in front of the PDR and red those behind it. The peak emission in the PDR is delineated by the black curve in the first panel (those with [O i]145 μm fluxes higher than 75% of the peak intensity of the line) and are plotted as plus symbols in the subsequent panels. The reference points for the adopted cut are numbered and shown in the first panel (Sect. 5), and have been plotted as black dots with error bars in subsequent panels to give an indication of the uncertainties.
Current usage metrics show cumulative count of Article Views (full-text article views including HTML views, PDF and ePub downloads, according to the available data) and Abstracts Views on Vision4Press platform.
Data correspond to usage on the plateform after 2015. The current usage metrics is available 48-96 hours after online publication and is updated daily on week days.
Initial download of the metrics may take a while.