Fig. 3
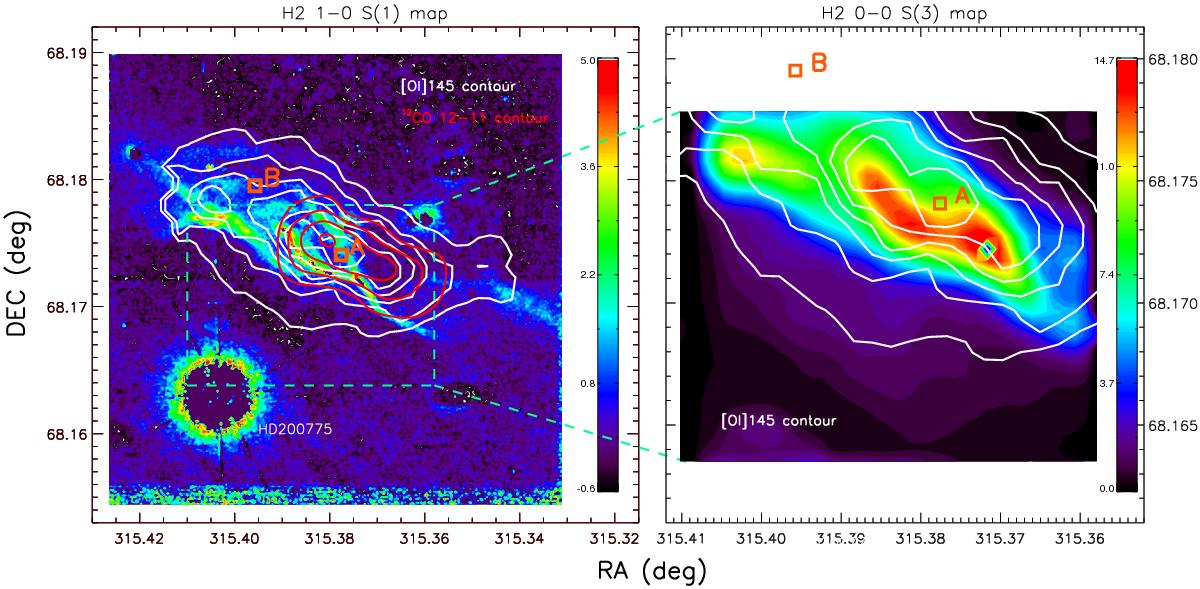
Left panel: spatial correlation of the H2 1-0 S(1) emission map at 2.12 μm (Lemaire et al. 1996) compared with the [O i] (145 μm) and 12CO J = 12−11 (Köhler et al. 2014) contour maps in white and red. To better illustrate the filaments, these images have not been convolved to the largest beam (in this case, CO). The two orange symbols (squares) mark the position where the high-excitation CO lines are detected (A), and a nearby position with similar conditions but without highly excited CO emission (B). These positions are discussed in Sect. 3.2. Right panel: H2 0-0 S(3) map at 9.7 μm convolved to the [O i] 145 μm beam with its contours in white. In both panels the colour bar intensities are in units of 10-7 W m-2 sr-1, where the four highest contours have values of 5.4, 4.7, 3.9, and 3.1 for [O i]145 μm, and of 0.37, 0.3, 0.2, and 0.1 for CO.
Current usage metrics show cumulative count of Article Views (full-text article views including HTML views, PDF and ePub downloads, according to the available data) and Abstracts Views on Vision4Press platform.
Data correspond to usage on the plateform after 2015. The current usage metrics is available 48-96 hours after online publication and is updated daily on week days.
Initial download of the metrics may take a while.