Fig. 2
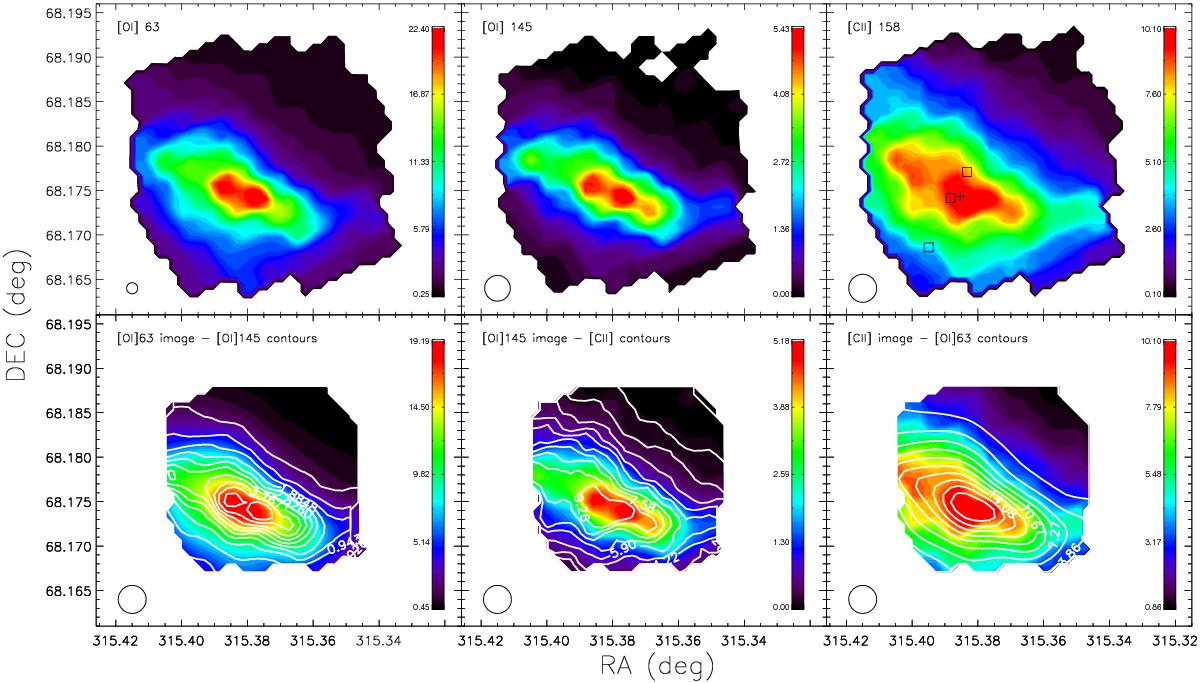
Upper three panels: observed images for the [O i]63 μm, [O i]145 μm, and [C ii]158 μm lines. Lower panels: combination of lines with contour maps over-plotted in white. The bottom images have been convolved to the 158 μm (largest) beam, with the beam size illustrated in the bottom left of each panel. The squares and plus symbols in the upper right panel indicate the positions used to compare the [C ii]158 μm flux with previous measurements in the literature (see Sect. 2). All maps are in flux units of 10-7 W m-2 sr-1. The eight highest contours are at 100, 91, 82, 74, 65, 56, 47, and 38% of the peak emission.
Current usage metrics show cumulative count of Article Views (full-text article views including HTML views, PDF and ePub downloads, according to the available data) and Abstracts Views on Vision4Press platform.
Data correspond to usage on the plateform after 2015. The current usage metrics is available 48-96 hours after online publication and is updated daily on week days.
Initial download of the metrics may take a while.