Free Access
Fig. 7
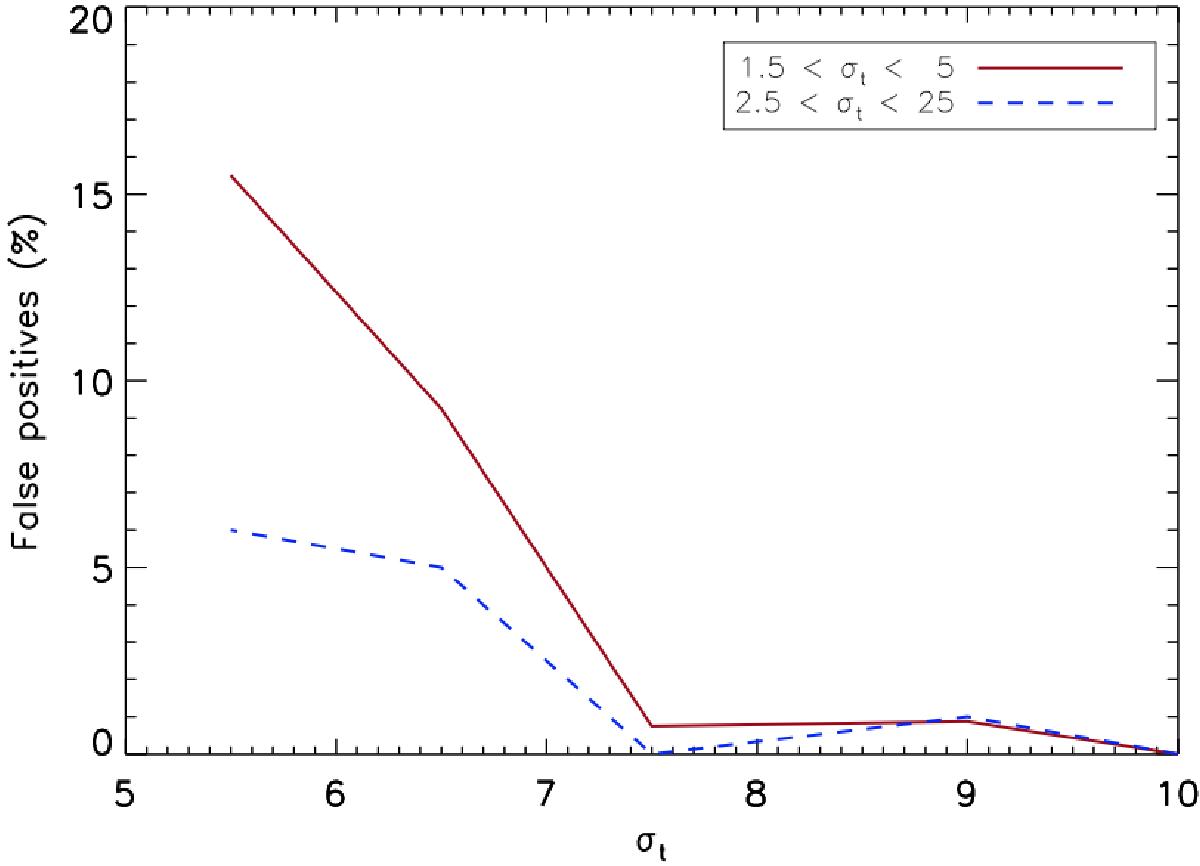
Percentage of false positives identified for various thresholds σt for two simulated fields, TS1 with faint sources (red line) and TS2 with bright sources (blue dashed line). The fraction of false positives decreases with increasing threshold values.
Current usage metrics show cumulative count of Article Views (full-text article views including HTML views, PDF and ePub downloads, according to the available data) and Abstracts Views on Vision4Press platform.
Data correspond to usage on the plateform after 2015. The current usage metrics is available 48-96 hours after online publication and is updated daily on week days.
Initial download of the metrics may take a while.