Fig. 6
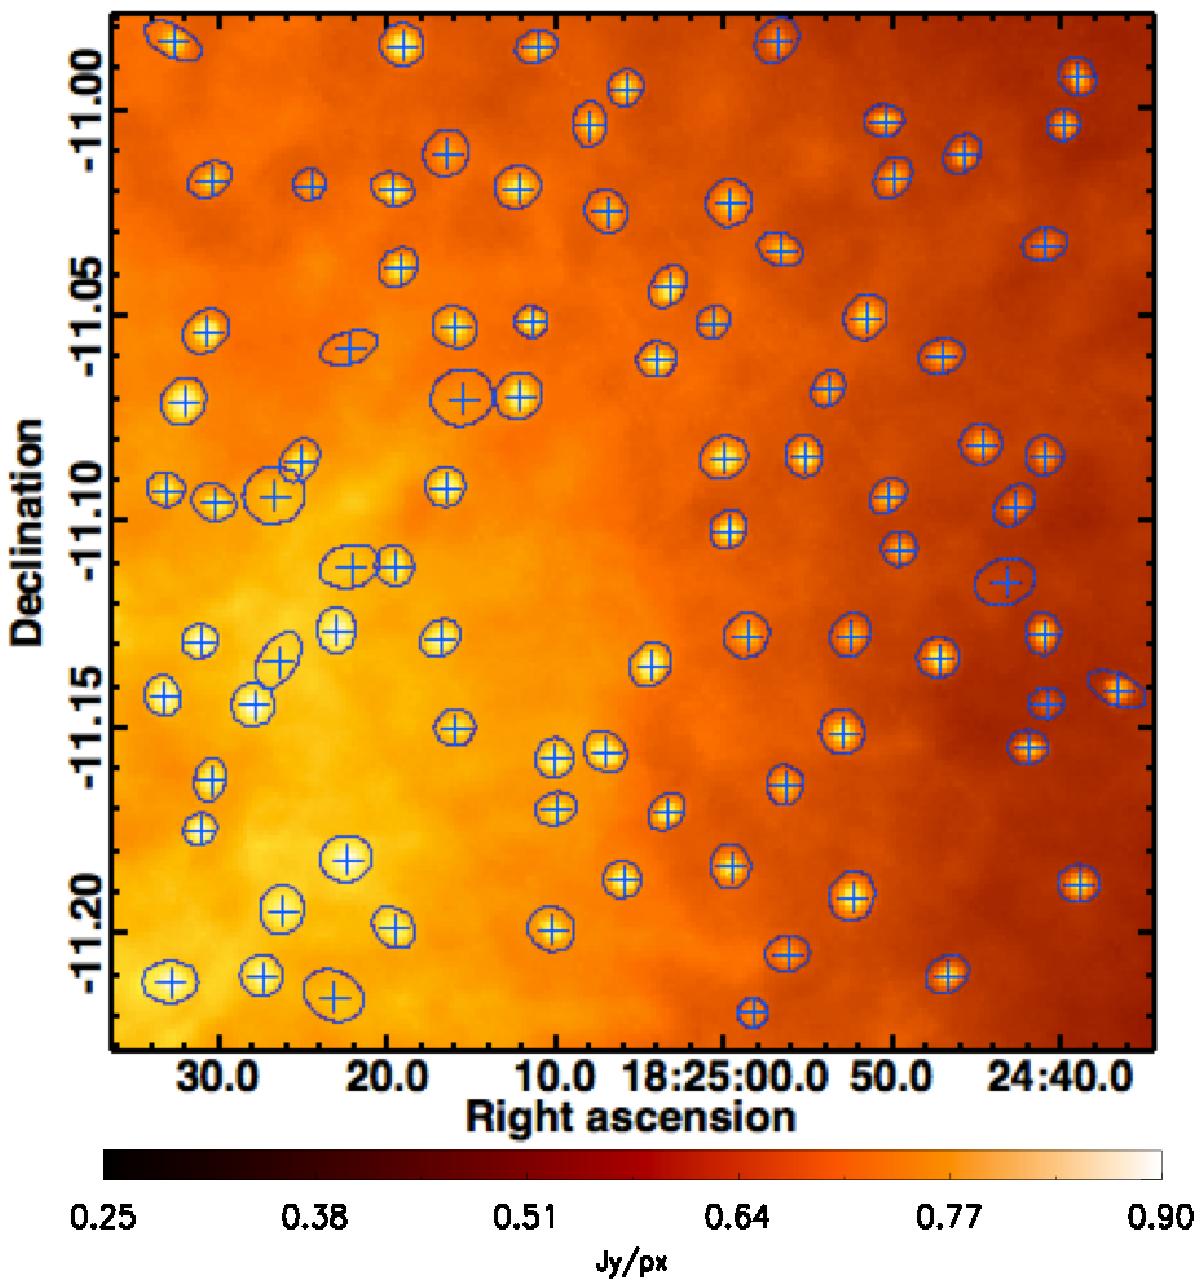
One realisation of the TS1 run with 80 injected sources on top of true background, extracted from the Hi-GAL 160 μm map centred at on (l,b) = (20.6°,0.7°). The blue ellipses are the source identified by Hyper using a threshold σt of 6.5. The ellipses describe the aperture regions of the sources, evaluated as discussed in Sect. 3.
Current usage metrics show cumulative count of Article Views (full-text article views including HTML views, PDF and ePub downloads, according to the available data) and Abstracts Views on Vision4Press platform.
Data correspond to usage on the plateform after 2015. The current usage metrics is available 48-96 hours after online publication and is updated daily on week days.
Initial download of the metrics may take a while.