Fig. 5
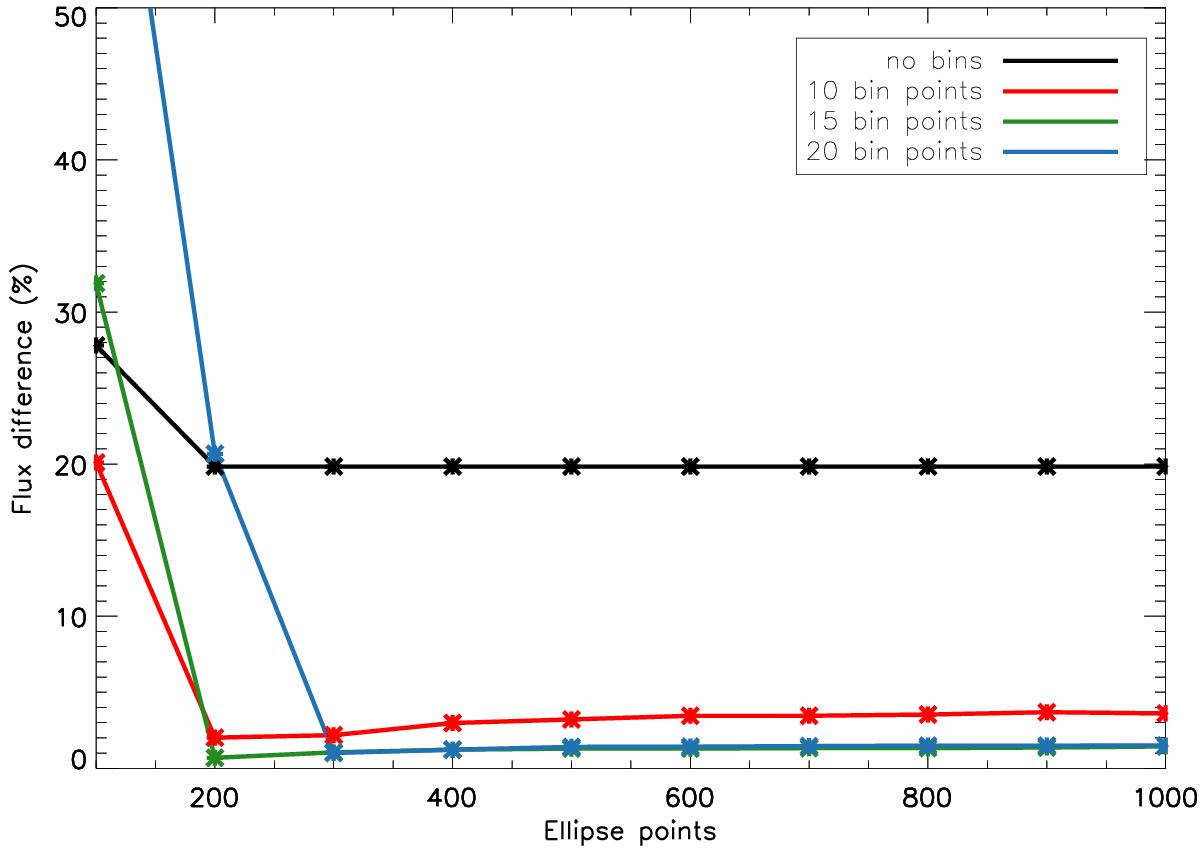
Flux difference in percentage with varying the number of points describing the ellipse for different bins used to oversample each pixel with respect to the reference model flux. The differences are ≤1.5% using more than 200 points to describe each ellipse and with at least a bin value per side of 15 (green and blue lines). When using no bins (black line) the percentage is remarkably high and independent of the number of points describing the ellipse (using at least 200 points). In fact it implies integrating the entire pixel values for all the pixels with which the ellipse points is described.
Current usage metrics show cumulative count of Article Views (full-text article views including HTML views, PDF and ePub downloads, according to the available data) and Abstracts Views on Vision4Press platform.
Data correspond to usage on the plateform after 2015. The current usage metrics is available 48-96 hours after online publication and is updated daily on week days.
Initial download of the metrics may take a while.