Free Access
Fig. 4
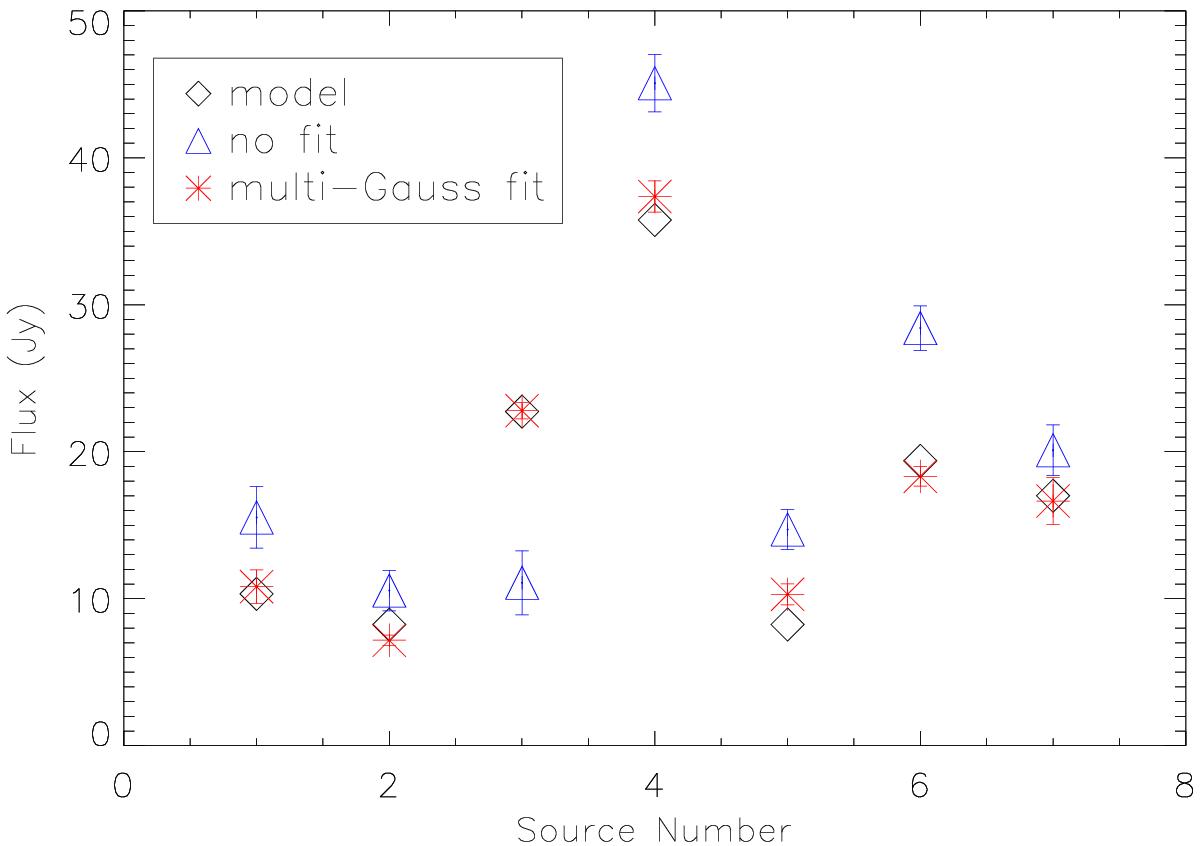
Results of deblending the seven partially overlapping sources shown in Fig. 3. The flux of the 2D Gaussian source model for each source is shown as a black diamond. The source flux evaluated without any companions removal is shown as a blue triangle, and after companion removal is shown as a red asterisk.
Current usage metrics show cumulative count of Article Views (full-text article views including HTML views, PDF and ePub downloads, according to the available data) and Abstracts Views on Vision4Press platform.
Data correspond to usage on the plateform after 2015. The current usage metrics is available 48-96 hours after online publication and is updated daily on week days.
Initial download of the metrics may take a while.