Fig. 3
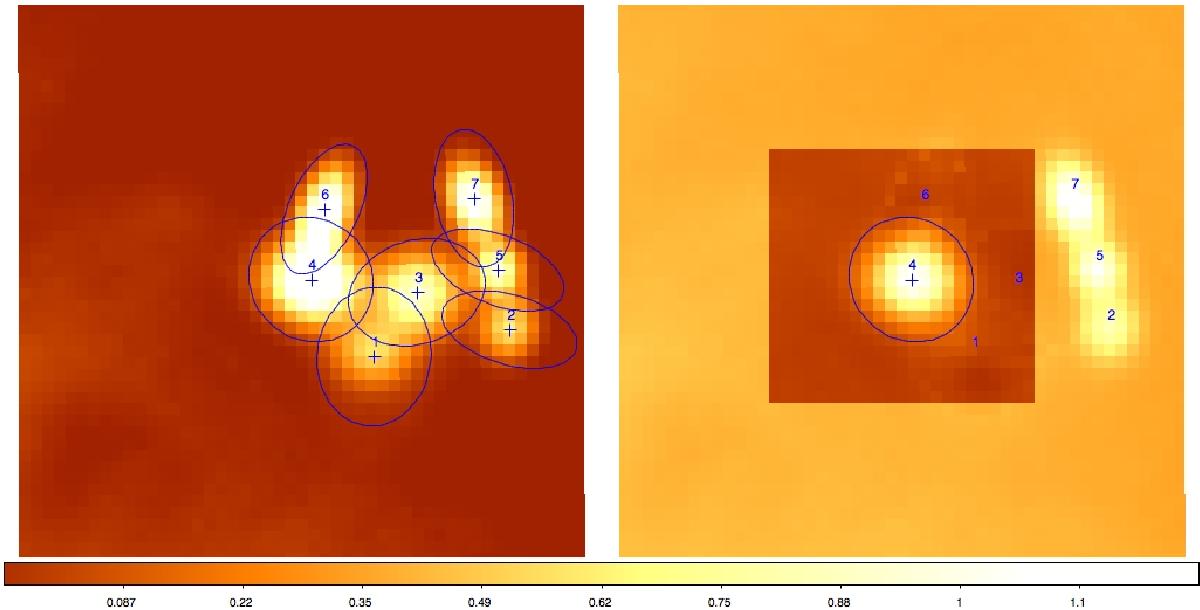
Left: simulation of seven blended sources with the corresponding Hyper profiles. Each ellipse represents the aperture area of the sources. The semi-axes are equal to the FWHMs obtained from the 2D Gaussian fit. Right: map of source 4 after companions removal done with the simultaneous multi-Gaussian fit and local background subtraction as described in the text. Only three sources contribute to the flux at the position of source 3 (sources 1, 3 and 6) and have been deblended. The rectangular region in the right panel is the local region where the background for the source 3 is evaluated after the deblending as described in Sect. 3.1. The residuals are low and they do not lead to severe flux errors for the reference source (Table 2).
Current usage metrics show cumulative count of Article Views (full-text article views including HTML views, PDF and ePub downloads, according to the available data) and Abstracts Views on Vision4Press platform.
Data correspond to usage on the plateform after 2015. The current usage metrics is available 48-96 hours after online publication and is updated daily on week days.
Initial download of the metrics may take a while.