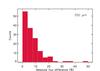
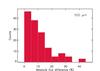
Fig. C.1
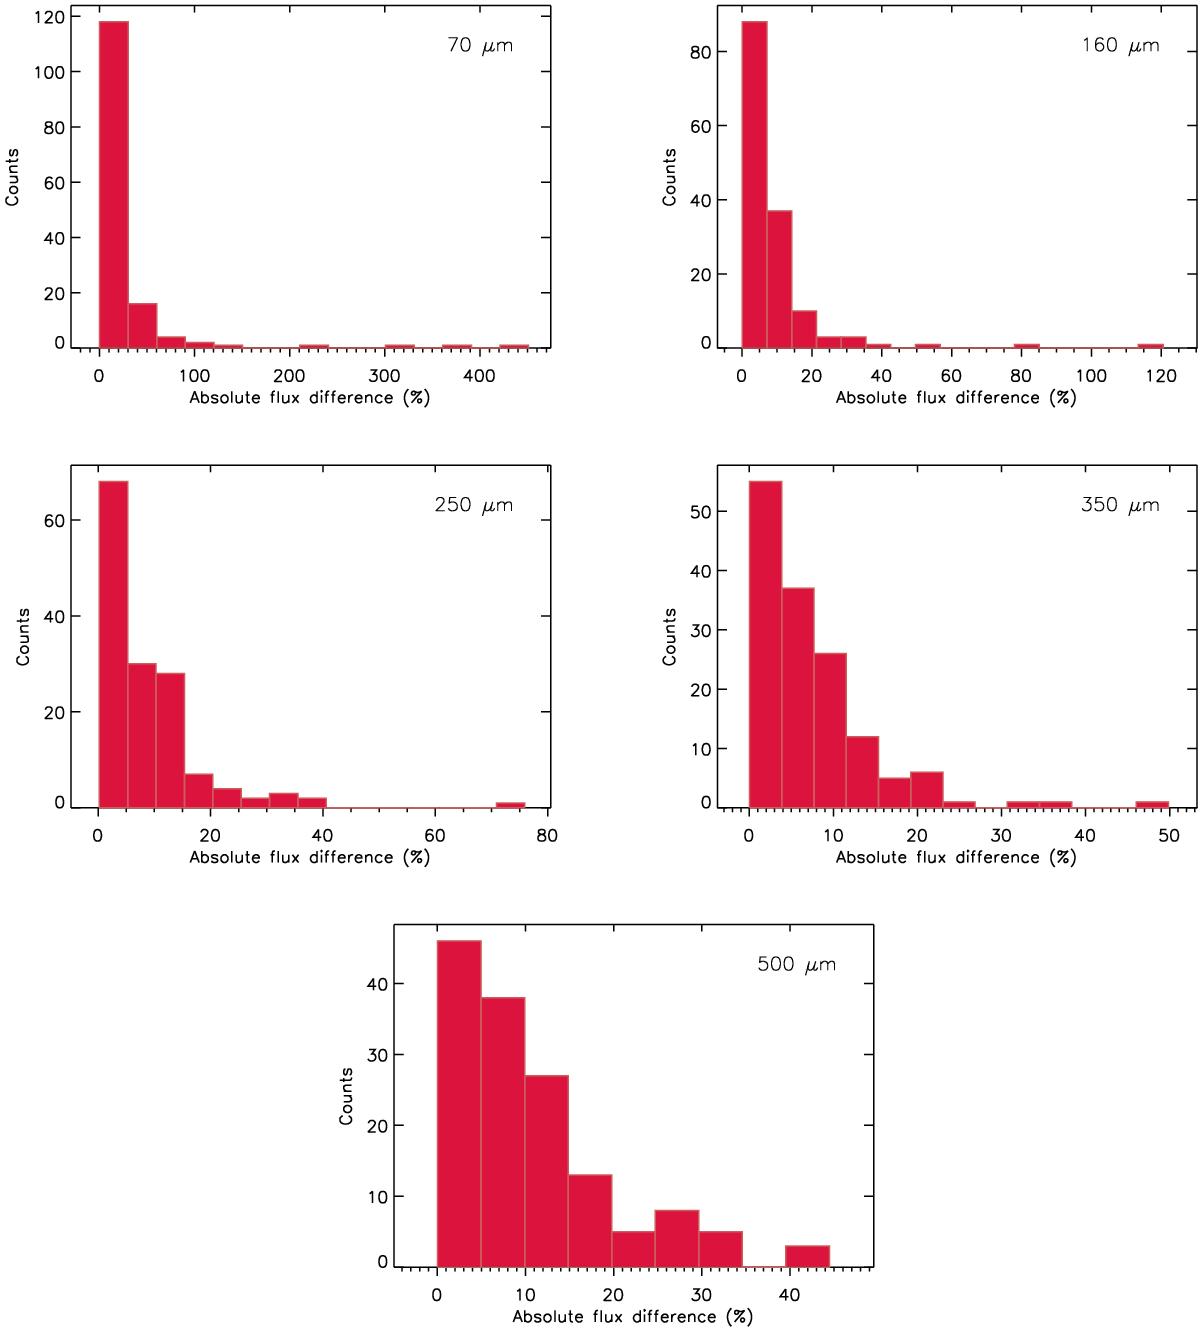
Histogram of the absolute flux difference between the flux of the injected sources and the Hyper fluxes at each wavelengths with flux measured in the 500 μm aperture region as described in Sect. 4.4. The sources are 145 at each wavelength, all the sources with no clustered companions as described in Sect. 4.4. The figures show the 70 μm (upper left panel), 160 μm (upper right), 250 μm (centre left), 350 μm (centre right) and 500 μm (lower panel) distributions.
Current usage metrics show cumulative count of Article Views (full-text article views including HTML views, PDF and ePub downloads, according to the available data) and Abstracts Views on Vision4Press platform.
Data correspond to usage on the plateform after 2015. The current usage metrics is available 48-96 hours after online publication and is updated daily on week days.
Initial download of the metrics may take a while.