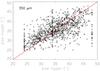
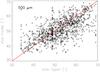
Fig. B.1
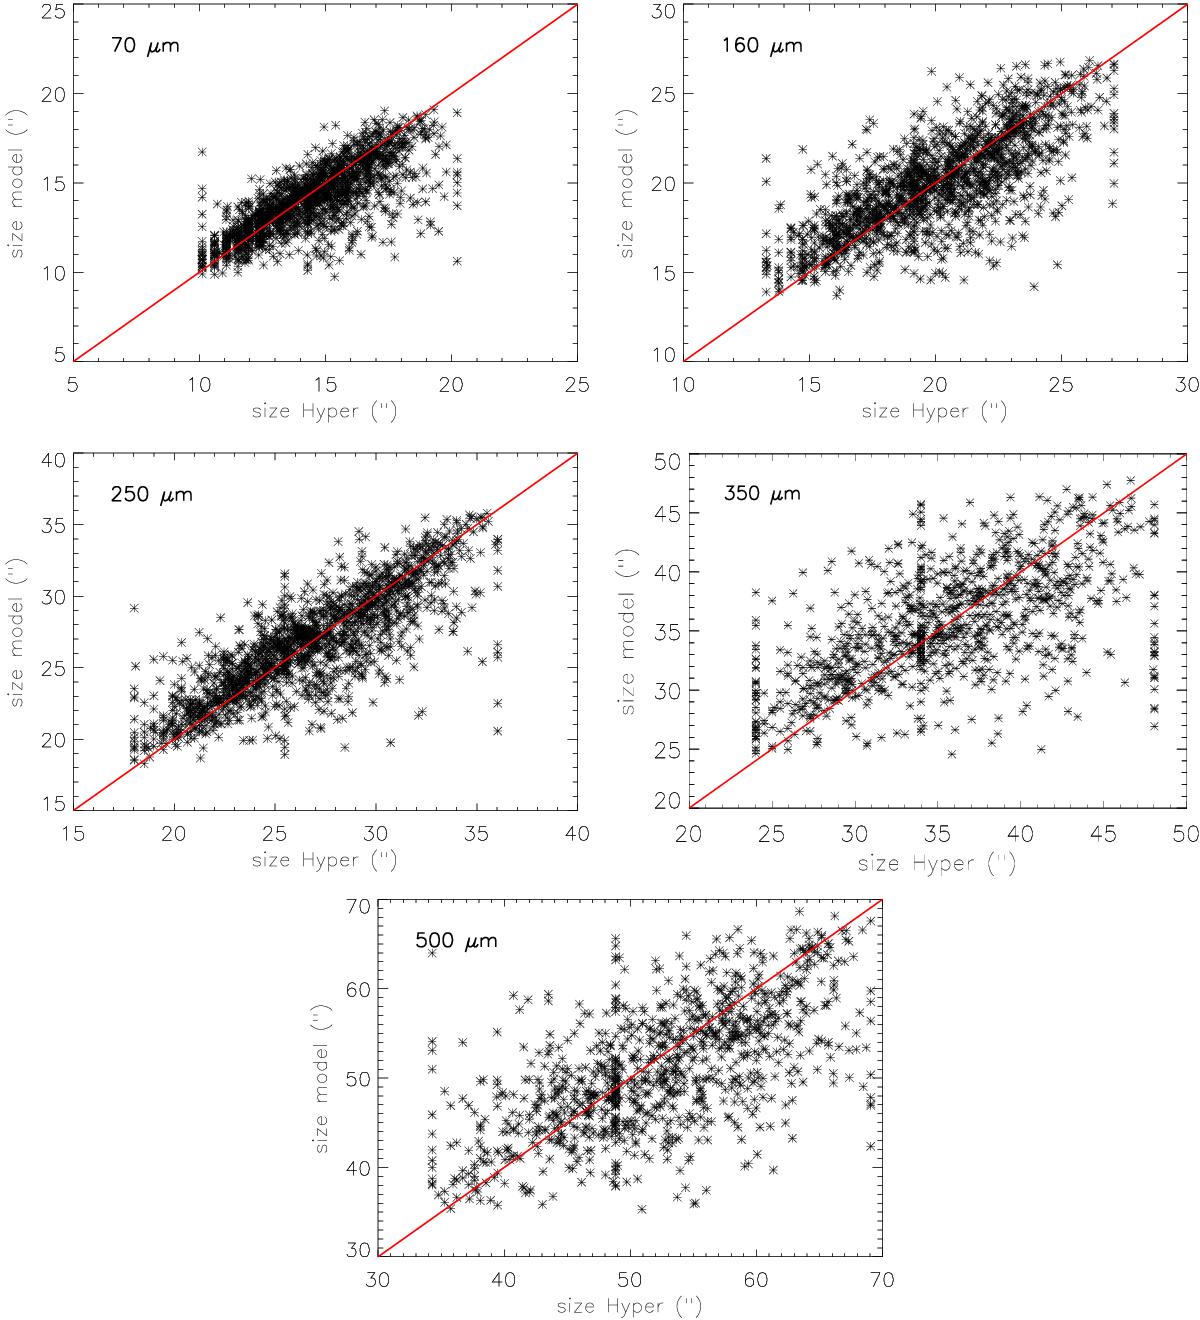
Comparison of the injected and measured source size for run T1, evaluated as the geometrical mean between the minimum and the maximum aperture radius. 70 μm size distribution (upper left panel), 160 μm (upper right), 250 μm (centre left), 350 μm (centre right) and 500 μm (lower panel). There are less than 1% of the points distributed along three vertical lines, corresponding to fixed Hyper source radii. The lowest and the highest radii correspond to the sources that Hyper has forced to be equal to a circular 2D Gaussian with FWHM equal to, respectively, the minimum and the maximum aperture radius chosen in the parameter file. The central points are in correspondence of fits that did not converge. In these cases Hyper has forced the source shape to be circular with a FWHM equal to the geometrical mean of the minimum and maximum FWHM limits set in the parameters file.
Current usage metrics show cumulative count of Article Views (full-text article views including HTML views, PDF and ePub downloads, according to the available data) and Abstracts Views on Vision4Press platform.
Data correspond to usage on the plateform after 2015. The current usage metrics is available 48-96 hours after online publication and is updated daily on week days.
Initial download of the metrics may take a while.