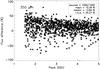
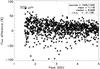
Fig. A.1
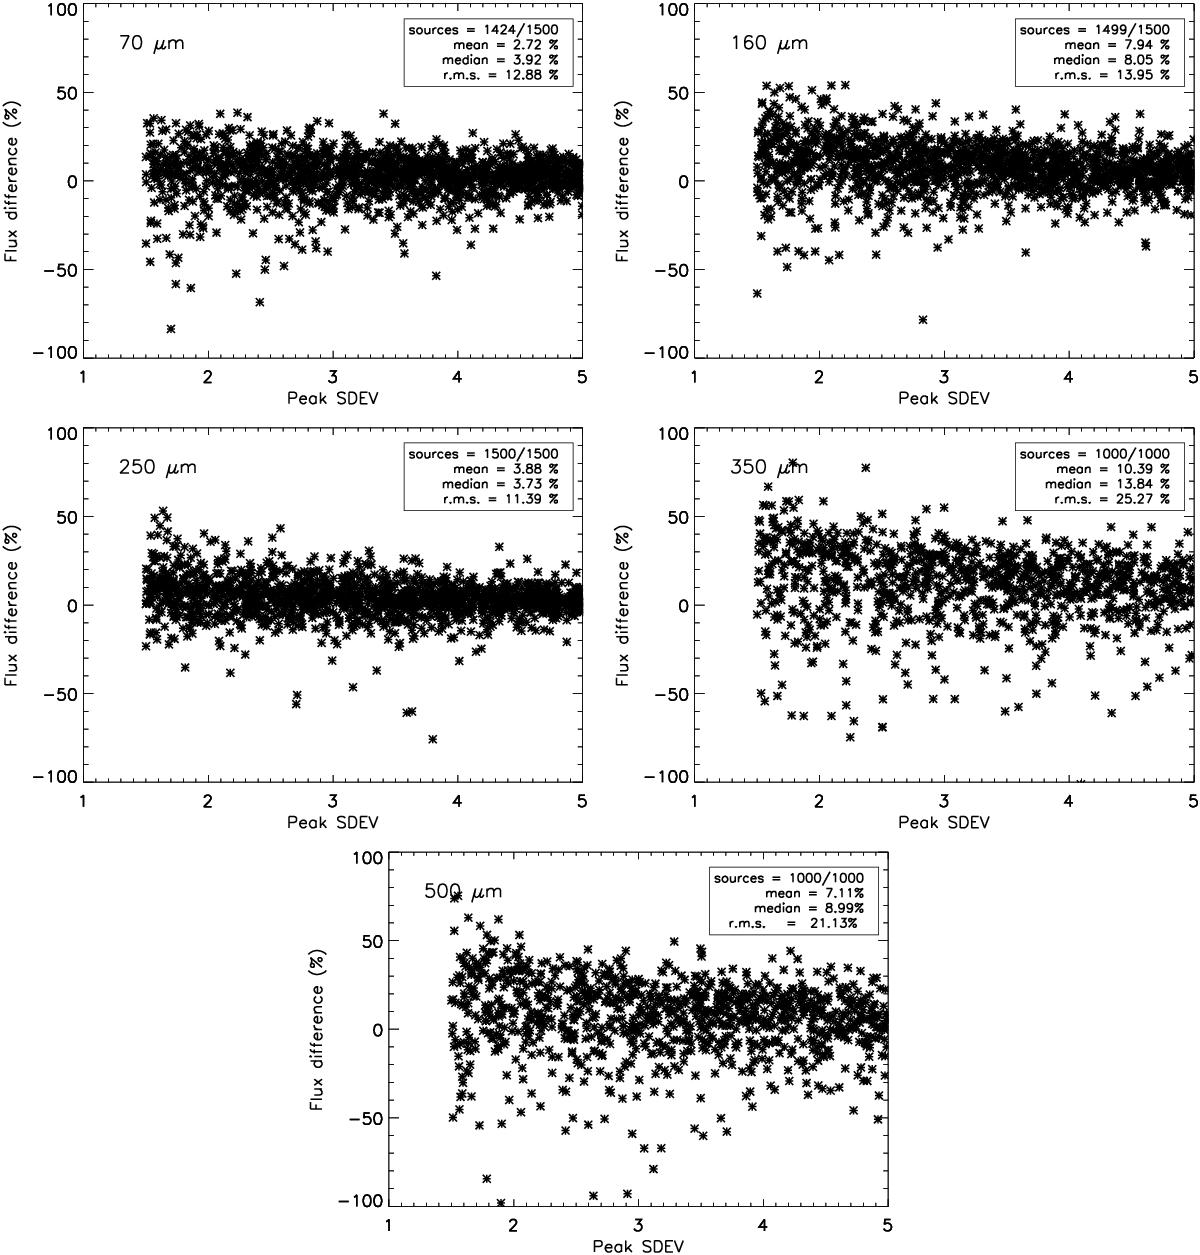
Difference between Hyper measured fluxes and the model fluxes as function of the source peak fluxes measured as a multiple of the standard deviation of the map (peak SDEV), for T1 at all wavelengths. 70 μm flux distribution (upper left panel), 160 μm (upper right), 250 μm (centre left), 350 μm (centre right) and 500 μm (lower panel). The mean and median values are only few percent and the rms of the distribution is only higher than 30% for the 350 μm map. Mostly for the faint sources the flux estimation is worse than 30%.
Current usage metrics show cumulative count of Article Views (full-text article views including HTML views, PDF and ePub downloads, according to the available data) and Abstracts Views on Vision4Press platform.
Data correspond to usage on the plateform after 2015. The current usage metrics is available 48-96 hours after online publication and is updated daily on week days.
Initial download of the metrics may take a while.