Fig. 15
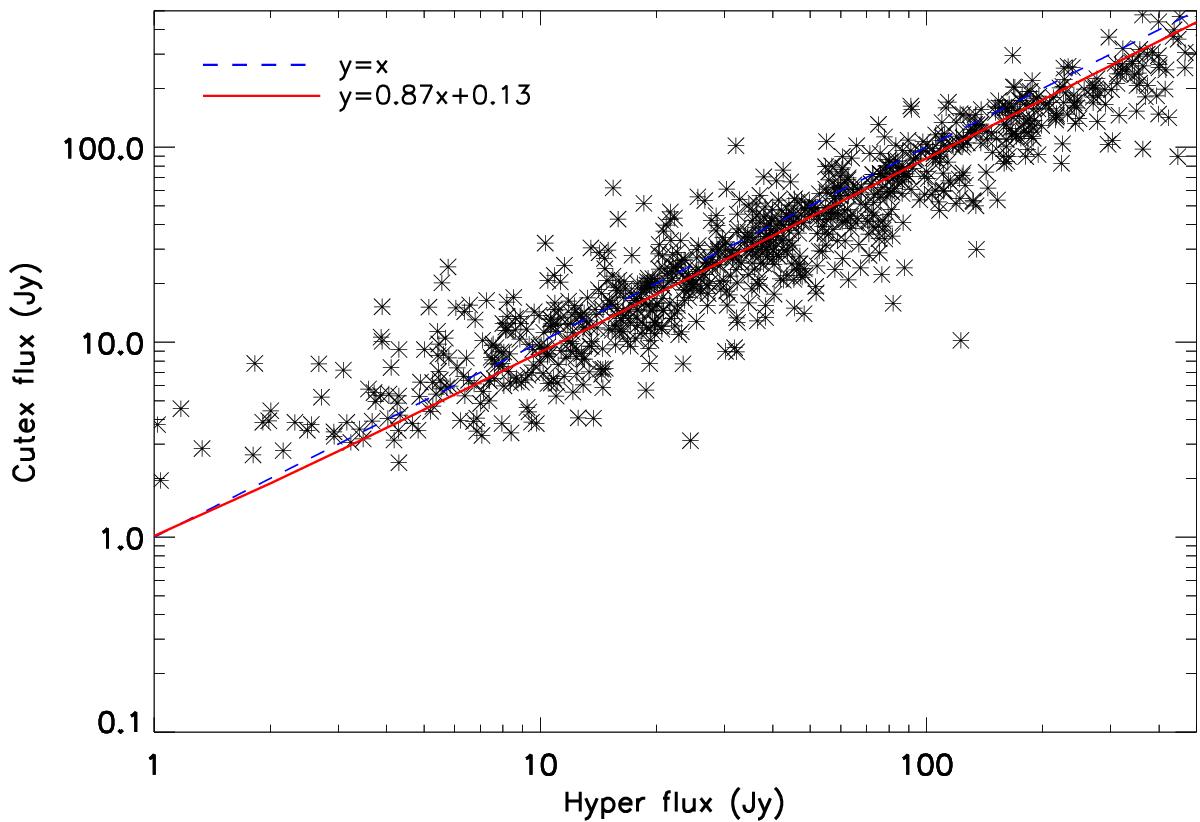
Comparison between Hyper and Cutex 250 μm integrated fluxes for ≃1000 compact sources extracted from the Traficante et al. (2014) survey of protostars associated with IRDCs in the Galactic range 15° ≤ l ≤ 55°. Blue dashed line: y = x straight line. Red line: linear fit of the distribution. The coefficient of the fit is m = 0.87, and the intercept is 0.13 Jy which indicate no systematics in the algorithms but a slight overestimate of the Hyper fluxes compared with the Cutex fluxes. The scatter is mostly due to the different background subtraction and deblending approaches.
Current usage metrics show cumulative count of Article Views (full-text article views including HTML views, PDF and ePub downloads, according to the available data) and Abstracts Views on Vision4Press platform.
Data correspond to usage on the plateform after 2015. The current usage metrics is available 48-96 hours after online publication and is updated daily on week days.
Initial download of the metrics may take a while.