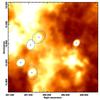
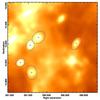
Fig. 12
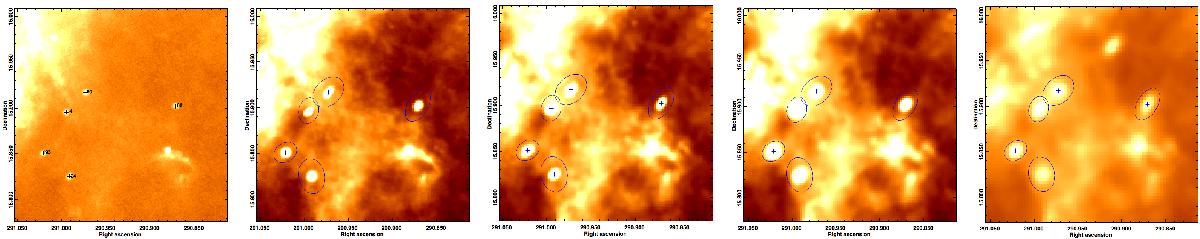
Zoom of a region with 5 injected sources extracted from the map showed in Fig. 11. From left to right: the same region observed at 70, 160, 250, 350 and 500 μm. The black cross in the 70 μm image identify the 5 source centroids. The blue ellipses in the other maps represent the Hyper source fit done in the 500 μm map which determines the aperture region at all wavelengths as described in Sect. 4.4.
Current usage metrics show cumulative count of Article Views (full-text article views including HTML views, PDF and ePub downloads, according to the available data) and Abstracts Views on Vision4Press platform.
Data correspond to usage on the plateform after 2015. The current usage metrics is available 48-96 hours after online publication and is updated daily on week days.
Initial download of the metrics may take a while.