Fig. D.2
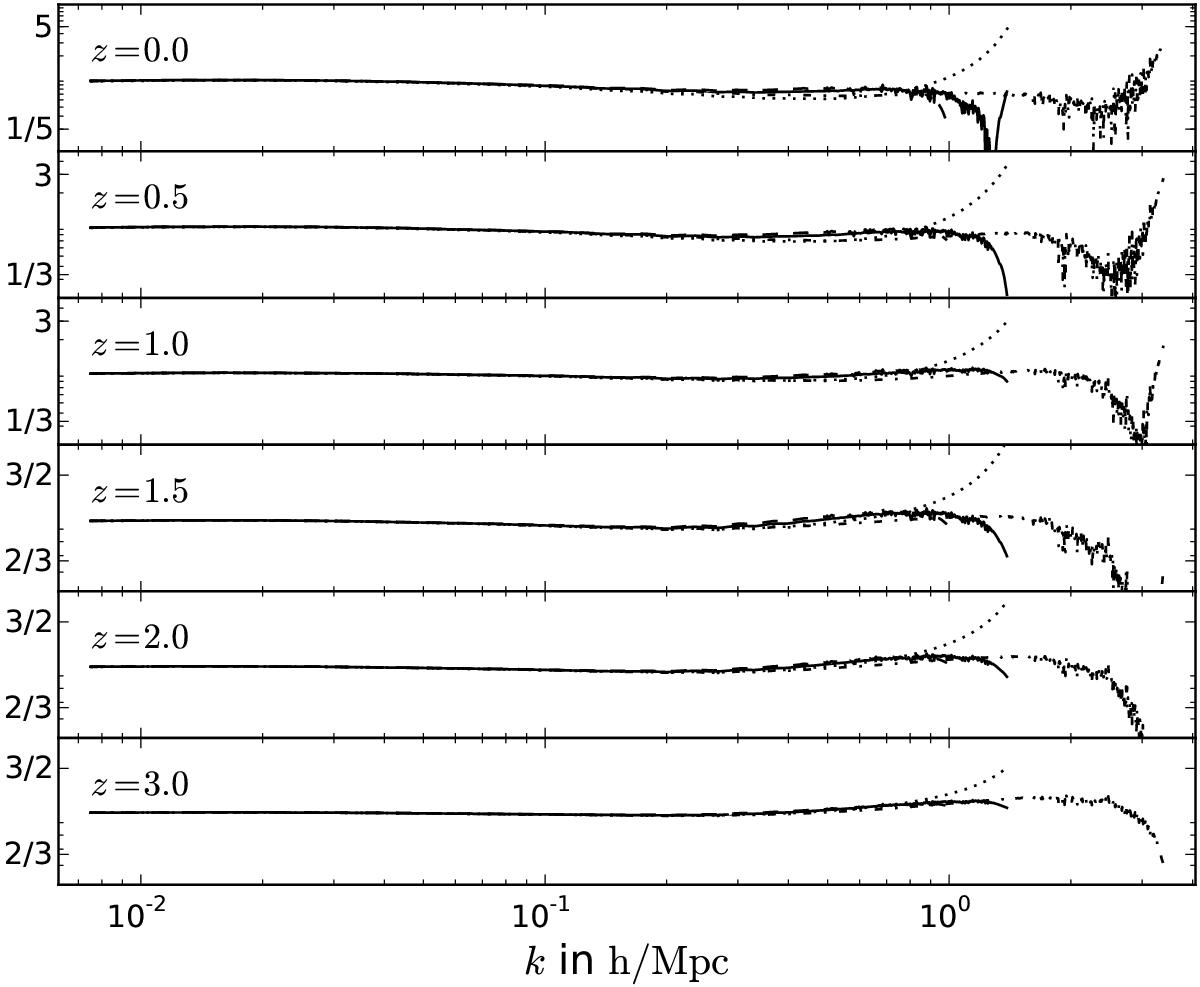
Backward converted spectra using different grids at a selection of redshifts. The panels show the ratio between the backward converted emulated spectrum (emulators as in Fig. D.1) and the linear spectrum. The solid line corresponds to grid B (the grid used in Sect. 3), the dashed line to grid A, the dot-dashed line to grid C, and the dotted line to grid D.
Current usage metrics show cumulative count of Article Views (full-text article views including HTML views, PDF and ePub downloads, according to the available data) and Abstracts Views on Vision4Press platform.
Data correspond to usage on the plateform after 2015. The current usage metrics is available 48-96 hours after online publication and is updated daily on week days.
Initial download of the metrics may take a while.