Fig. 8
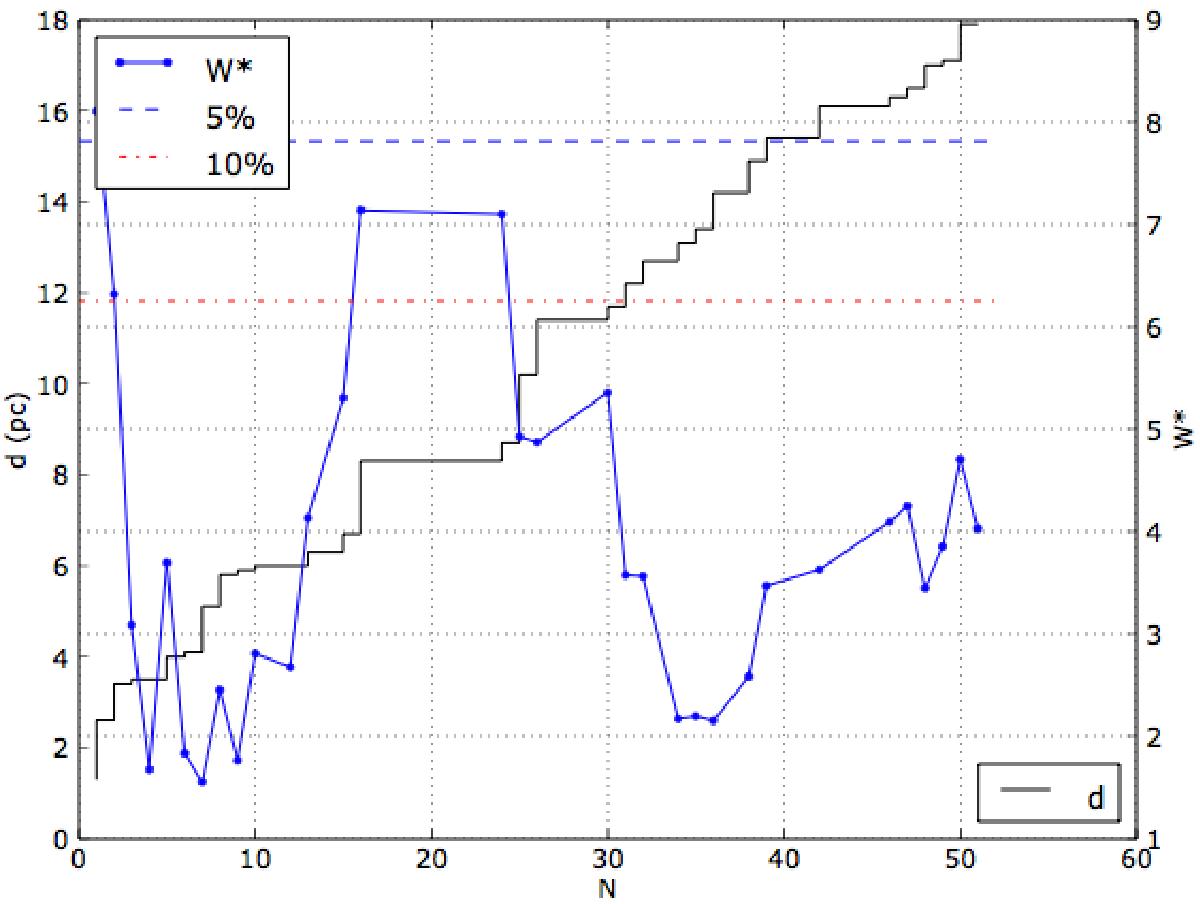
Same as Fig. 3, but restricted to binary systems
without evidence for higher multiplicity. The horizontal blue dashed and red
dash-dotted curves correspond to a first-kind risk of 5% and 10%, respectively, of
rejecting the null hypothesis of isotropy while it is true, based on the
![]() statistics. The systems have the same number labels as in Table 3 and Fig. 3.
statistics. The systems have the same number labels as in Table 3 and Fig. 3.
Current usage metrics show cumulative count of Article Views (full-text article views including HTML views, PDF and ePub downloads, according to the available data) and Abstracts Views on Vision4Press platform.
Data correspond to usage on the plateform after 2015. The current usage metrics is available 48-96 hours after online publication and is updated daily on week days.
Initial download of the metrics may take a while.