Fig. 3
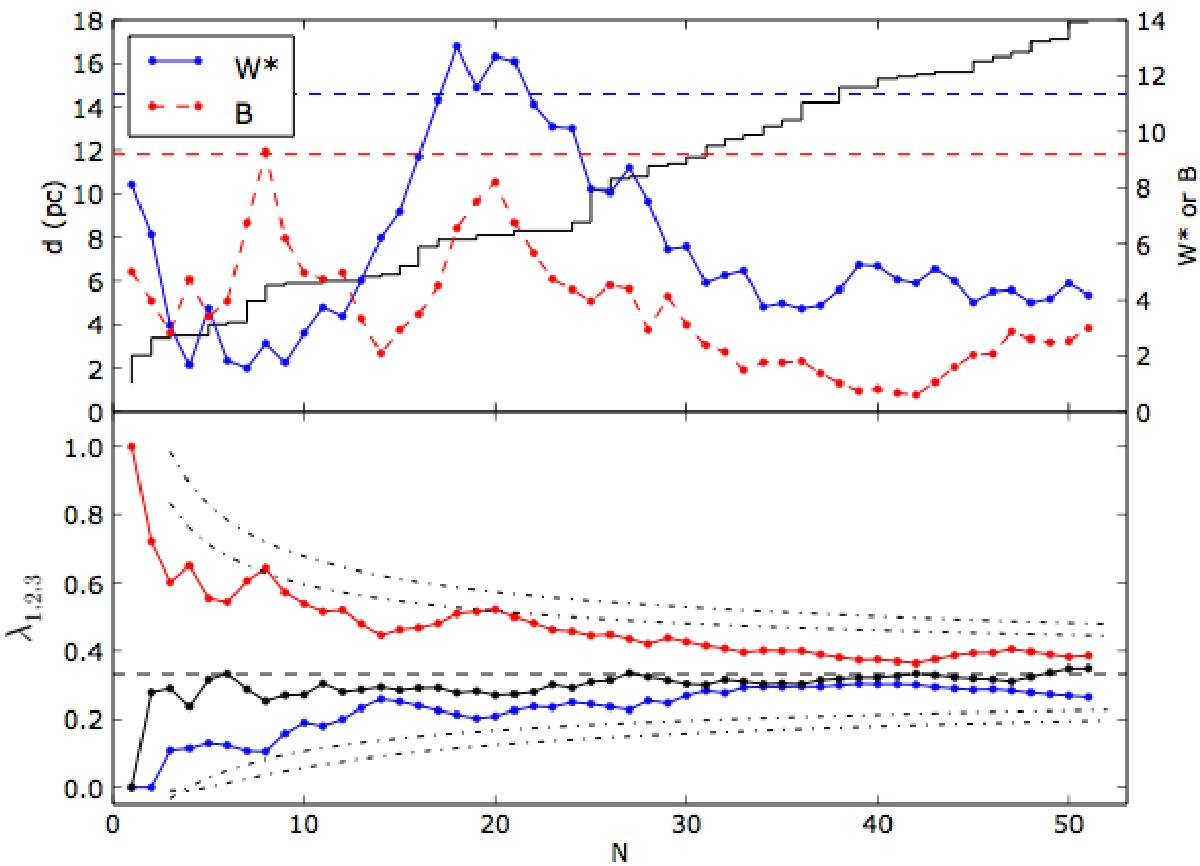
Upper panel: evolution of the Rayleigh-Watson
![]() (blue dashed line, and right-hand scale; the correction to
(blue dashed line, and right-hand scale; the correction to
![]() – Eq. (4) – has been made for a
confidence level α of 1%) and Bingham ℬ (red dot-dashed line, and right-hand
scale) statistics as a function of the number of systems. The horizontal blue dashed
curve corresponds to a first-kind risk of 1% of rejecting the null hypothesis of
isotropy while it is true, based on the
– Eq. (4) – has been made for a
confidence level α of 1%) and Bingham ℬ (red dot-dashed line, and right-hand
scale) statistics as a function of the number of systems. The horizontal blue dashed
curve corresponds to a first-kind risk of 1% of rejecting the null hypothesis of
isotropy while it is true, based on the ![]() statistics. The horizontal red dashed line is the 10% first-kind risk for the
ℬ statistics. The
number of systems as a function of distance is given by the black solid line and
left-hand scale. Isotropy corresponds to ℬ → 0 and
statistics. The horizontal red dashed line is the 10% first-kind risk for the
ℬ statistics. The
number of systems as a function of distance is given by the black solid line and
left-hand scale. Isotropy corresponds to ℬ → 0 and ![]() . Lower
panel: three eigenvalues of the orientation matrix (Eq. (6)). Isotropy corresponds to
λ1,2,3 = 1
/ 3, as seen at large distances. The critical values for
λ1,3 corresponding to
α =
1% and 10% as given by Eqs. (11) and (12) are
displayed by the dash-dotted lines.
. Lower
panel: three eigenvalues of the orientation matrix (Eq. (6)). Isotropy corresponds to
λ1,2,3 = 1
/ 3, as seen at large distances. The critical values for
λ1,3 corresponding to
α =
1% and 10% as given by Eqs. (11) and (12) are
displayed by the dash-dotted lines.
Current usage metrics show cumulative count of Article Views (full-text article views including HTML views, PDF and ePub downloads, according to the available data) and Abstracts Views on Vision4Press platform.
Data correspond to usage on the plateform after 2015. The current usage metrics is available 48-96 hours after online publication and is updated daily on week days.
Initial download of the metrics may take a while.