Fig. A.8
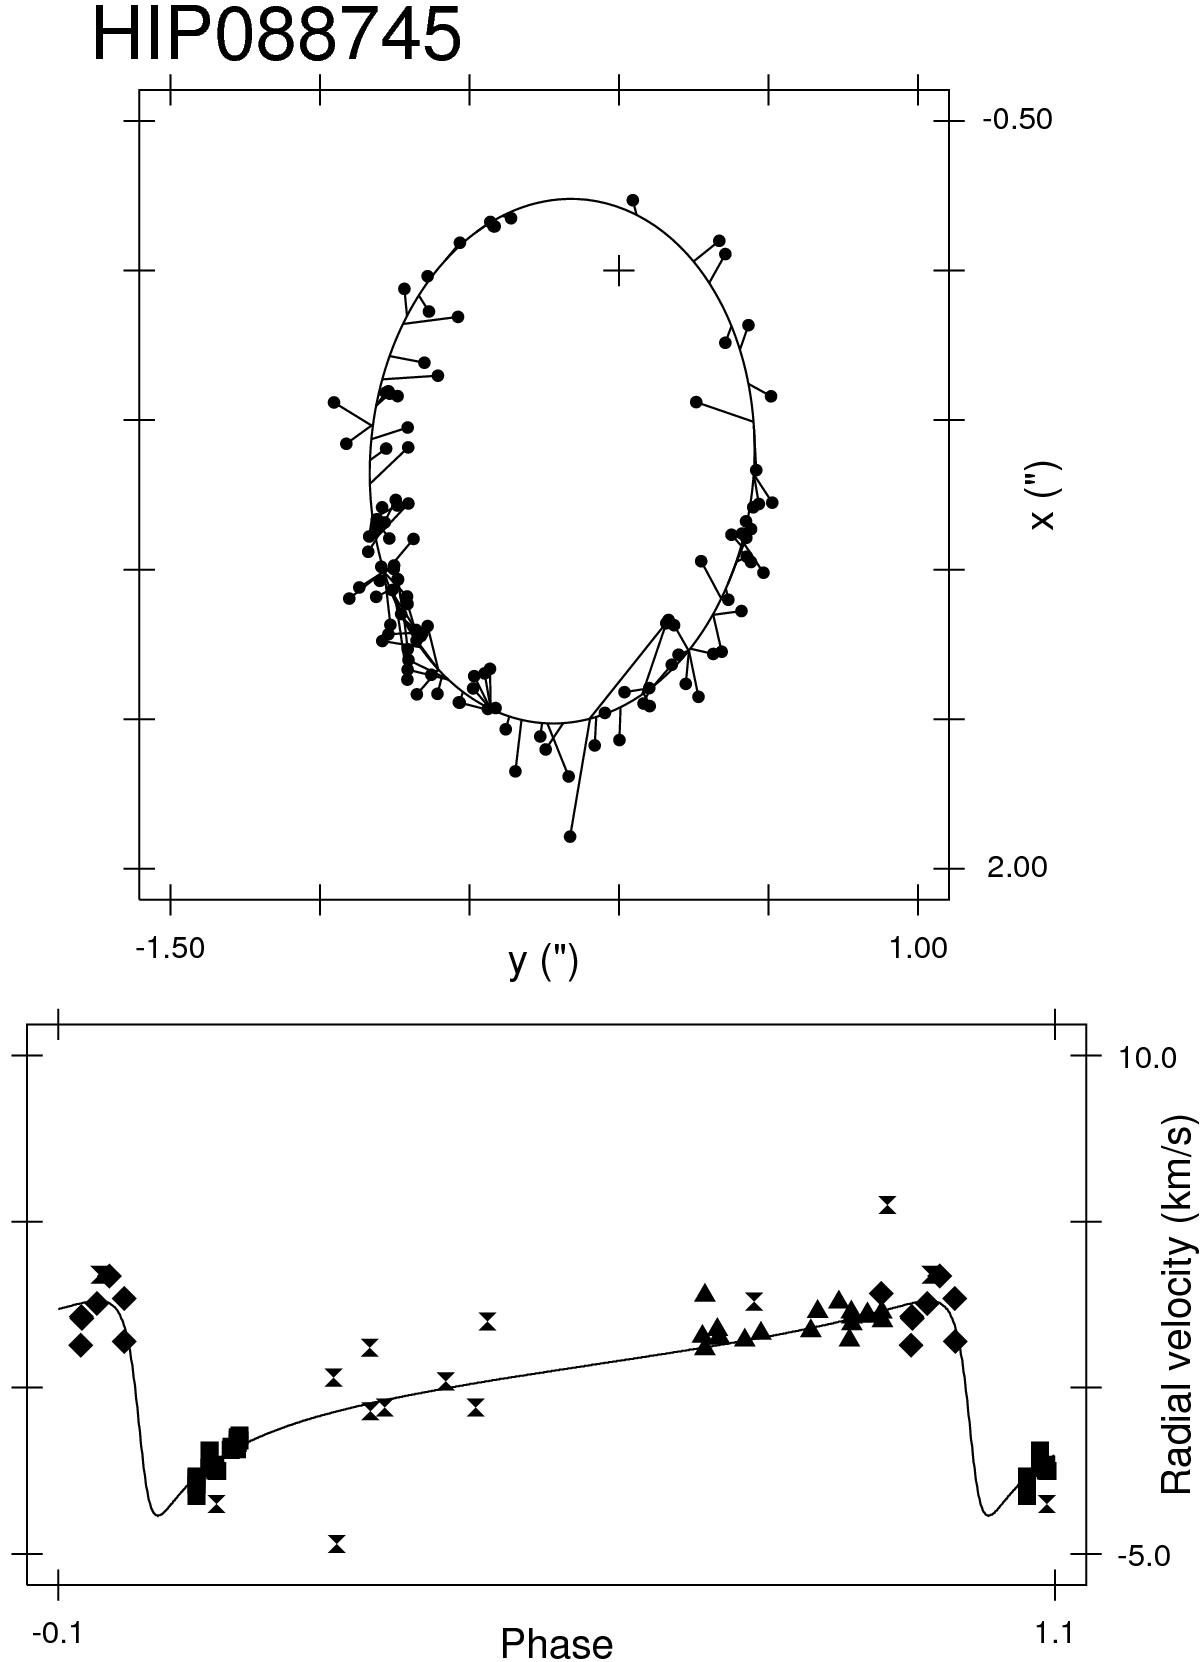
Combined astrometric (upper panel) and spectroscopic (lower panel) orbit for WDS 18070+3034AB. The solid line in the lower panel corresponds to the predicted velocity curve for A. Individual measurements for the visual orbit were taken from the WDS database at USNO. In the lower panel, triangles correspond to CORAVEL data, squares to velocities from Abt & Willmarth (2006), diamonds to Tokovinin & Smekhov (2002), and double triangles to the old radial velocities collected by Kamper & Beardsley (1986).
Current usage metrics show cumulative count of Article Views (full-text article views including HTML views, PDF and ePub downloads, according to the available data) and Abstracts Views on Vision4Press platform.
Data correspond to usage on the plateform after 2015. The current usage metrics is available 48-96 hours after online publication and is updated daily on week days.
Initial download of the metrics may take a while.