Fig. 7
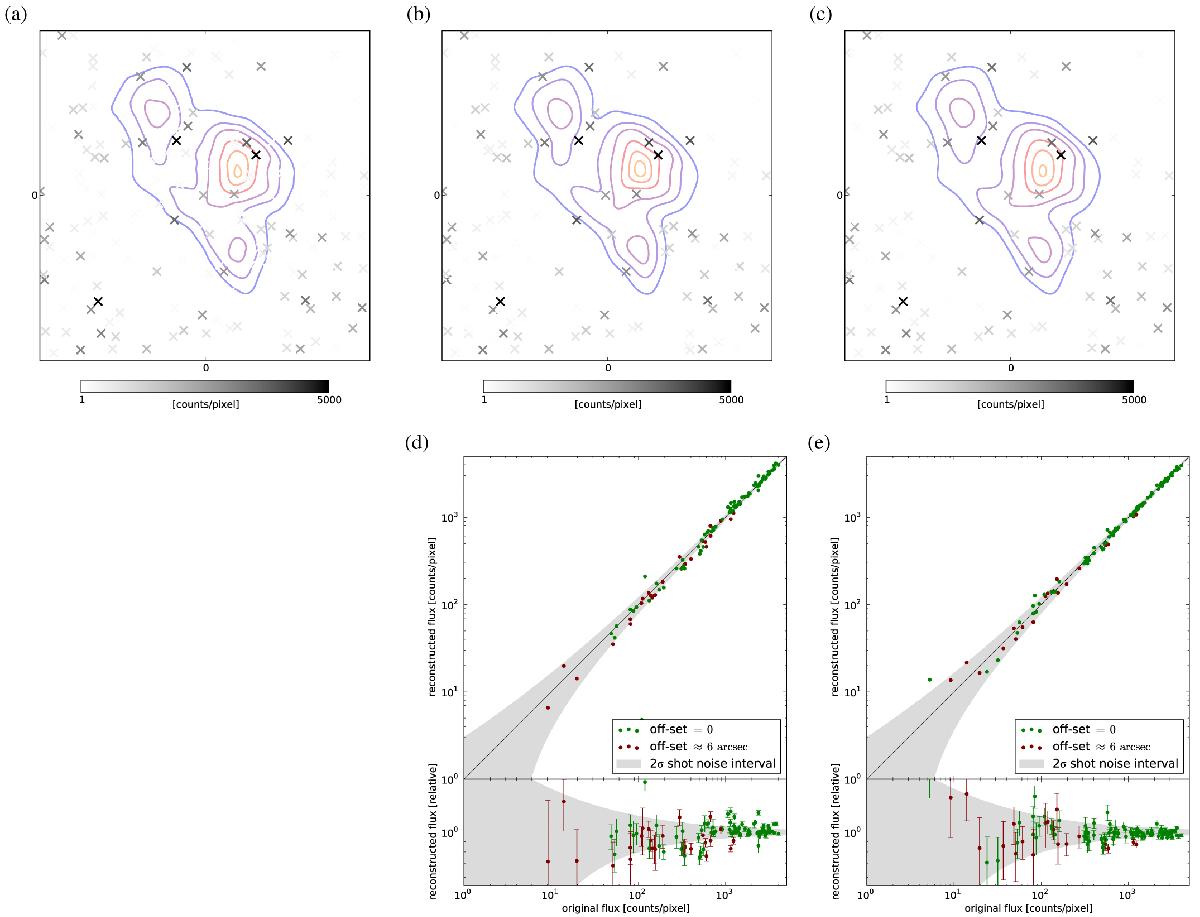
Illustration of the reconstruction of the point-like signal field u = log ρ(u) and its uncertainty. The top panels show the location (markers) and intensity (gray scale) of the point-like photon fluxes, underlaid is the respective diffuse contribution (contours) to guide the eye, cf. Fig 4. Panel a) shows the original simulation, panel b) the reconstruction using a MAP approach, and panel c) the reconstruction using a Gibbs approach. The bottom panelsd) and e) show the match between original and reconstruction in absolute and relative fluxes, the 2σ shot noise interval (gray contour), as well as some reconstruction uncertainty estimate (error bars).
Current usage metrics show cumulative count of Article Views (full-text article views including HTML views, PDF and ePub downloads, according to the available data) and Abstracts Views on Vision4Press platform.
Data correspond to usage on the plateform after 2015. The current usage metrics is available 48-96 hours after online publication and is updated daily on week days.
Initial download of the metrics may take a while.