Fig. 6
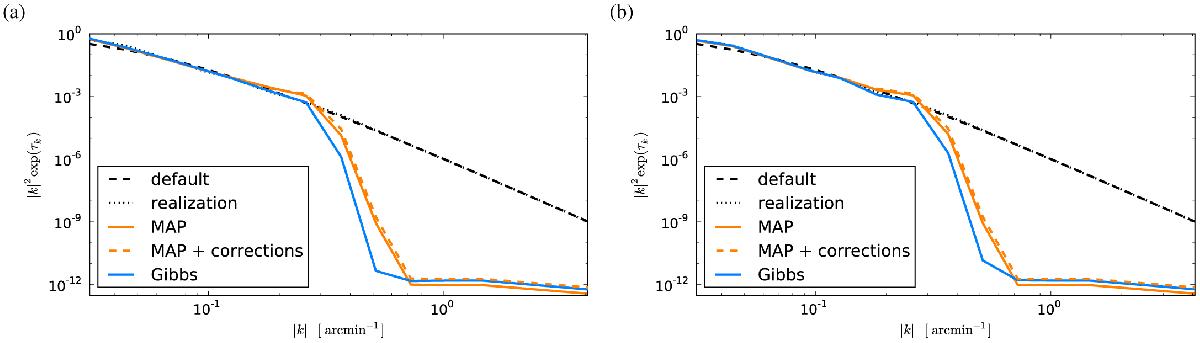
Illustration of the reconstruction of the logarithmic power spectrum τ. Both panels show the default power spectrum (black dashed line), and the simulated realization (black dotted line), as well as the reconstructed power spectra using a MAP (orange solid line), plus second order corrections (orange dashed line), and a Gibbs approach (blue solid line). Panel a) shows the reconstruction for a chosen σ parameter of 10, panel b) for a σ of 1000.
Current usage metrics show cumulative count of Article Views (full-text article views including HTML views, PDF and ePub downloads, according to the available data) and Abstracts Views on Vision4Press platform.
Data correspond to usage on the plateform after 2015. The current usage metrics is available 48-96 hours after online publication and is updated daily on week days.
Initial download of the metrics may take a while.