Fig. 3
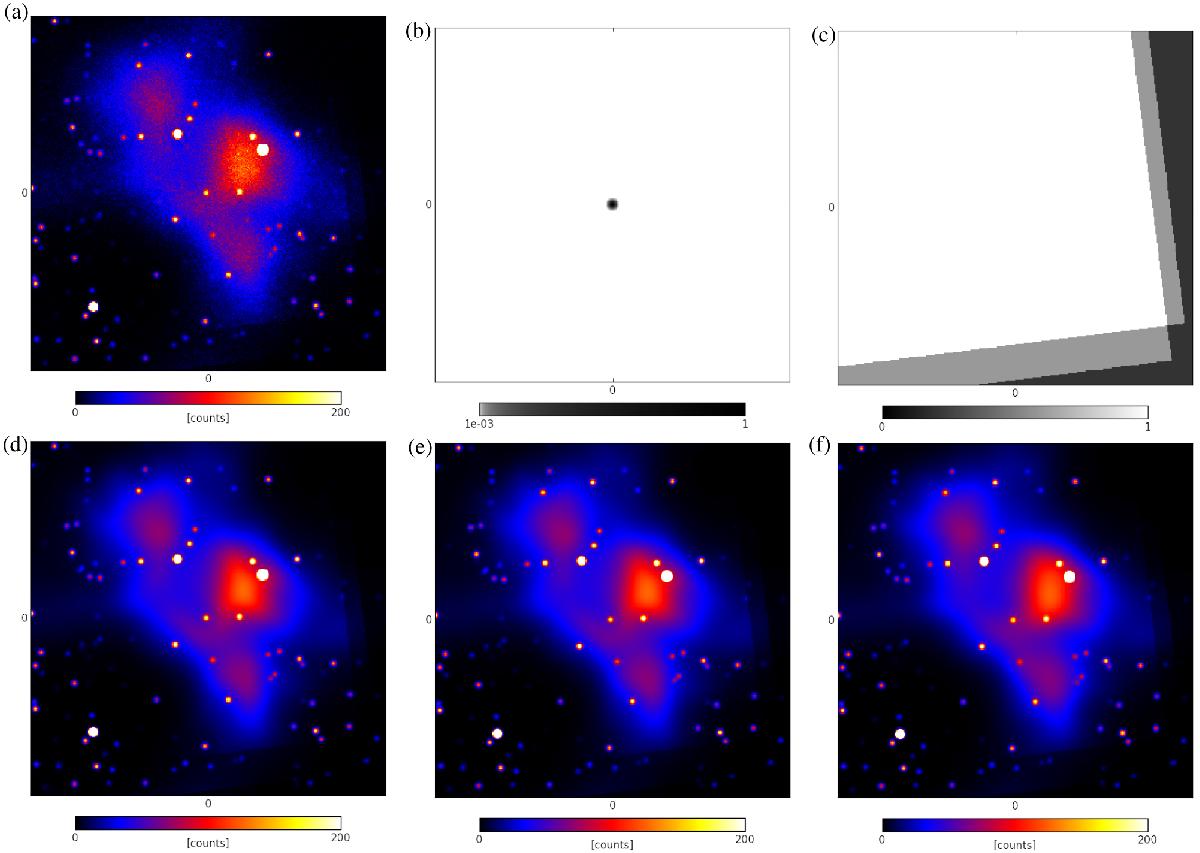
Illustration of the data and noiseless, but reconvolved, signal responses of the reconstructions. Panel a) shows the data from a mock observation of a 32 × 32 arcmin2 patch of the sky with a resolution of 0.1 arcmin corresponding to a total of 102 400 pixels. The data had been convolved with a Gaussian-like PSF (FWHM ≈ 0.2 arcmin= 2 pixels, finite support of 1.1 arcmin= 11 pixels) and masked because of an uneven exposure. Panel b) shows the centered convolution kernel. Panel c) shows the exposure mask. The bottom panels show the reconvolved signal response R⟨ρ⟩ of a reconstruction using a different approach each, namely d) MAP-δ, e) MAP-![]() , and f) Gibbs. All reconstructions shown here and in the following figures used the same model parameters: α = 1, q = 10-12, σ = 10,
, and f) Gibbs. All reconstructions shown here and in the following figures used the same model parameters: α = 1, q = 10-12, σ = 10, ![]() , and η = 10-4.
, and η = 10-4.
Current usage metrics show cumulative count of Article Views (full-text article views including HTML views, PDF and ePub downloads, according to the available data) and Abstracts Views on Vision4Press platform.
Data correspond to usage on the plateform after 2015. The current usage metrics is available 48-96 hours after online publication and is updated daily on week days.
Initial download of the metrics may take a while.