Fig. 9
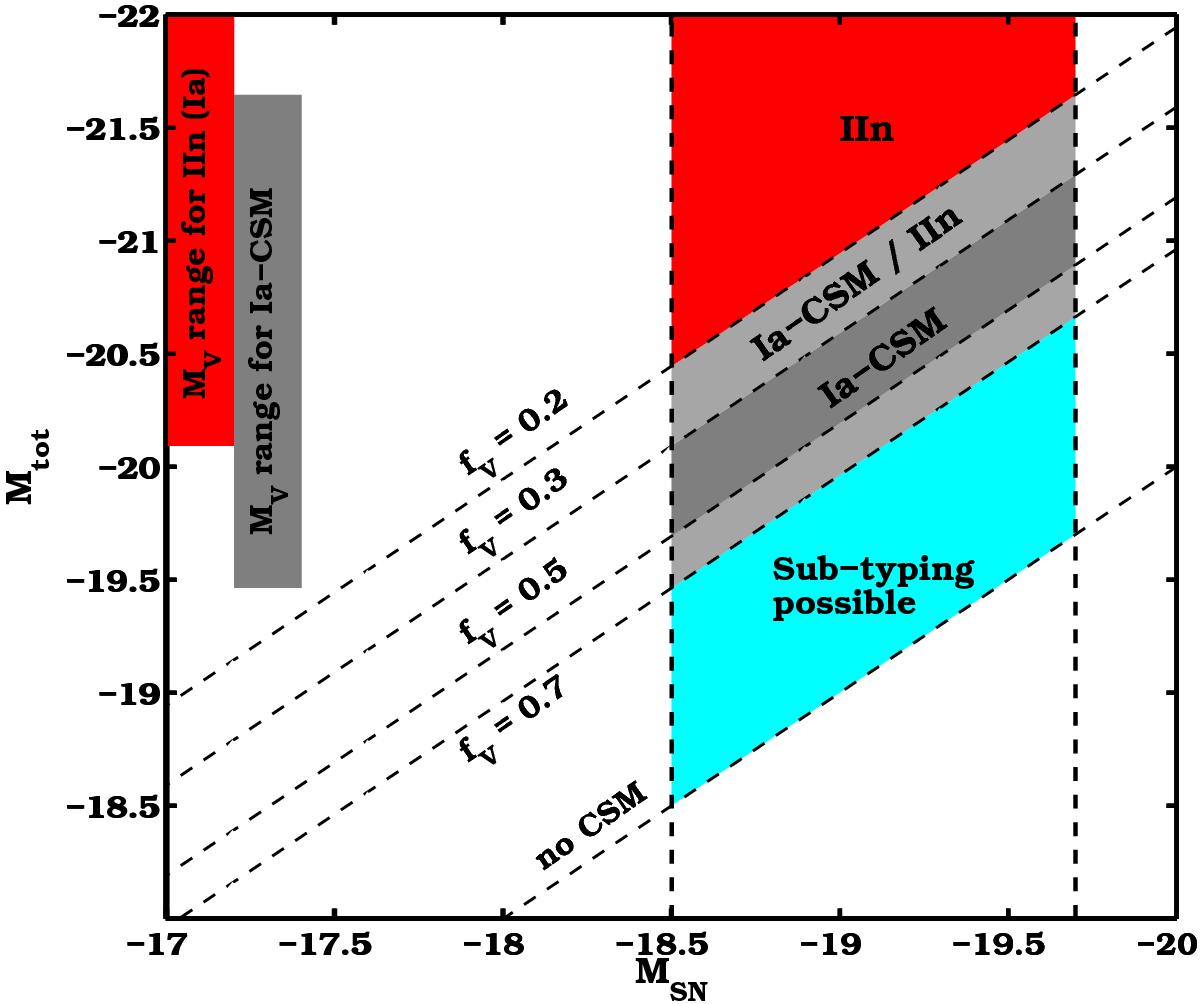
Total maximum luminosity of a SN interacting with a CSM (i.e. together with the continuum contribution), as a function of the underlying SN maximum luminosity and the ratio fV. The graph focuses on the magnitude region occupied by SNe Ia (vertical dashed lines). As shown before (e.g. Fig. 5), the spectrum of the SN interacting strongly with the CSM will receive different classifications, depending on the value of fV (diagonal dashed lines). SNe in the red-coloured area will be classified as a IIn (including IInS in this project) and SNe in the dark-grey area as Ia-CSM. Objects in the cyan area can be classified with their exact sub-type (e.g. 91T-like), while the light-grey areas represent transitional zones where more classifications are possible. It is therefore possible to determine the (un-extincted) magnitude region for SNe Ia-CSM (−19.5 >MV> −21.6) and the lower luminosity limit for a SN IIn that can hide a SN Ia (MV< −20.1). These regions are illustrated by the red and grey vertical bars on the top left.
Current usage metrics show cumulative count of Article Views (full-text article views including HTML views, PDF and ePub downloads, according to the available data) and Abstracts Views on Vision4Press platform.
Data correspond to usage on the plateform after 2015. The current usage metrics is available 48-96 hours after online publication and is updated daily on week days.
Initial download of the metrics may take a while.