Fig. 6
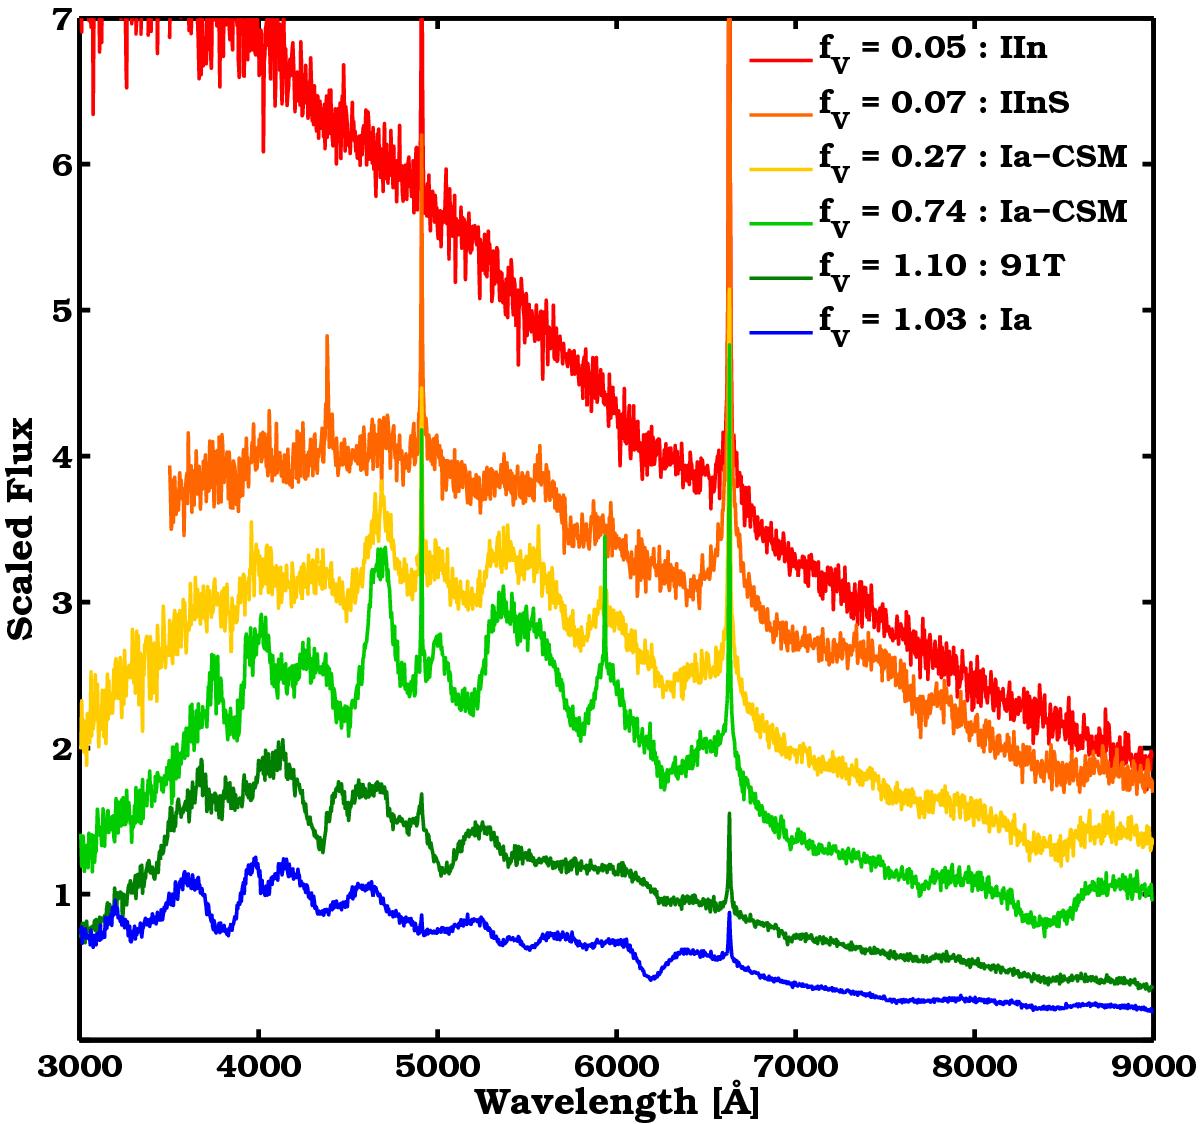
Representative spectra from the MC simulation, visualizing the effect of fV in the final spectrum appearance and classification. A normal SN Ia and a 91T-like event are shown at maximum light with fV ~ 1. Even at this 1:1 level, the CSM contamination is barely visible in the spectra. From objects that were classified as Ia-CSM we show two cases with fV = 0.74 and 0.27. At lower flux ratios, it is not possible to distinguish the spectral features and the SNe were classified progressively as IInS and IIn. The spectra have been scaled by arbitrary constants for presentation purposes.
Current usage metrics show cumulative count of Article Views (full-text article views including HTML views, PDF and ePub downloads, according to the available data) and Abstracts Views on Vision4Press platform.
Data correspond to usage on the plateform after 2015. The current usage metrics is available 48-96 hours after online publication and is updated daily on week days.
Initial download of the metrics may take a while.