Fig. 5
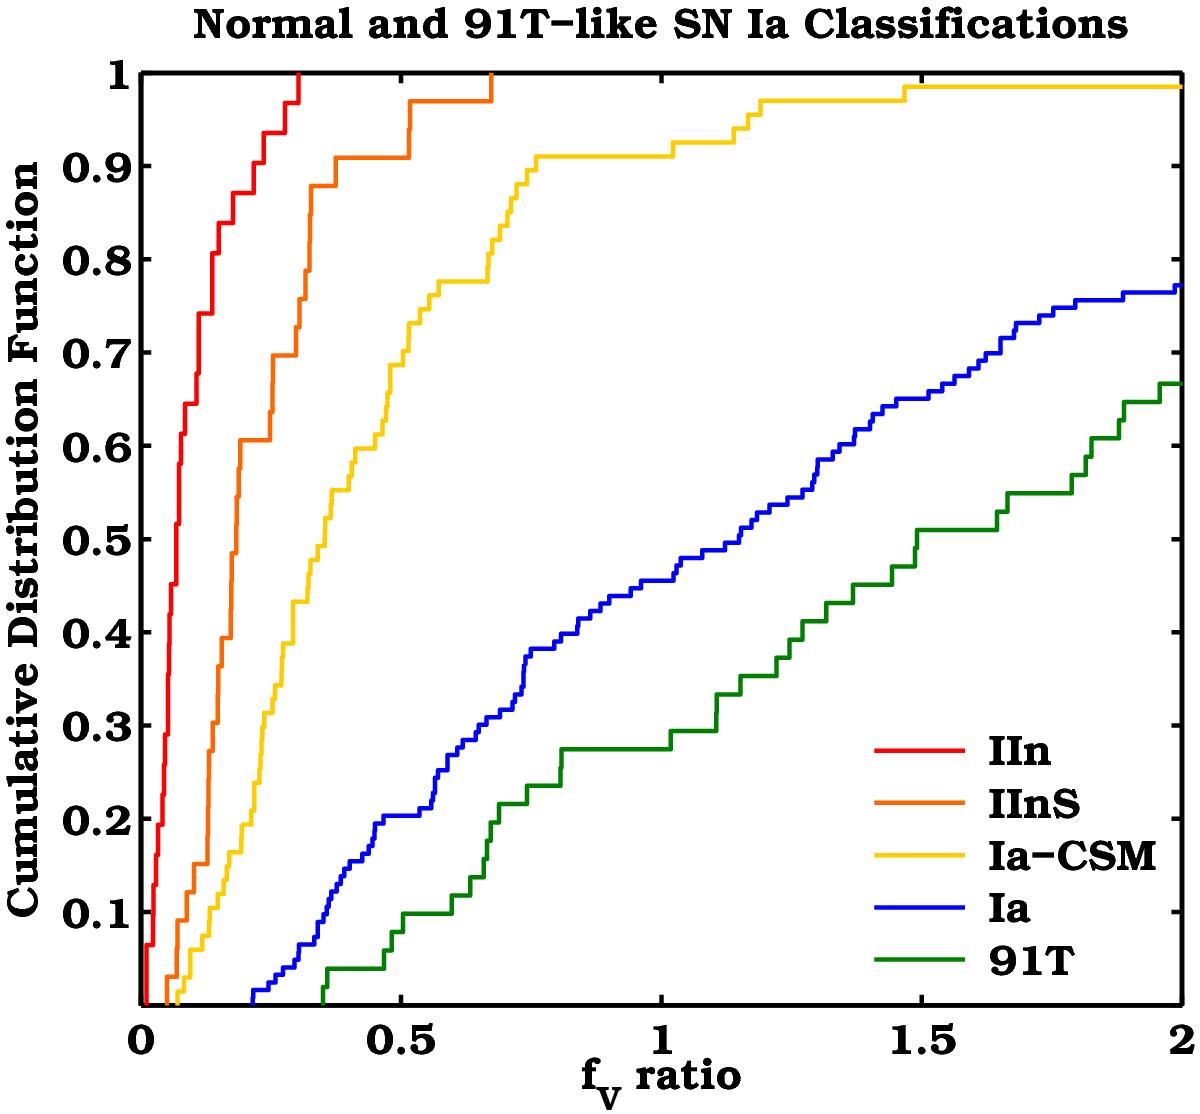
Distributions of all the simulated normal and 91T-like SNe Ia interacting with a CSM and how these were classified depending on the flux ratio fV. As fV decreases (the contribution of the BB continuum increases), the SN features become more diluted and the SNe are progressively classified as Ia-CSM, IInS, and IIn. All distributions are mutually statistically incompatible. The difference between the Ia and the 91T distributions is explained by the fact that 91T-like events are brighter, on average, than normal SNe Ia (by 0.4 mag in this simulation). The figure zooms in fV ≤ 2.
Current usage metrics show cumulative count of Article Views (full-text article views including HTML views, PDF and ePub downloads, according to the available data) and Abstracts Views on Vision4Press platform.
Data correspond to usage on the plateform after 2015. The current usage metrics is available 48-96 hours after online publication and is updated daily on week days.
Initial download of the metrics may take a while.