Fig. 4
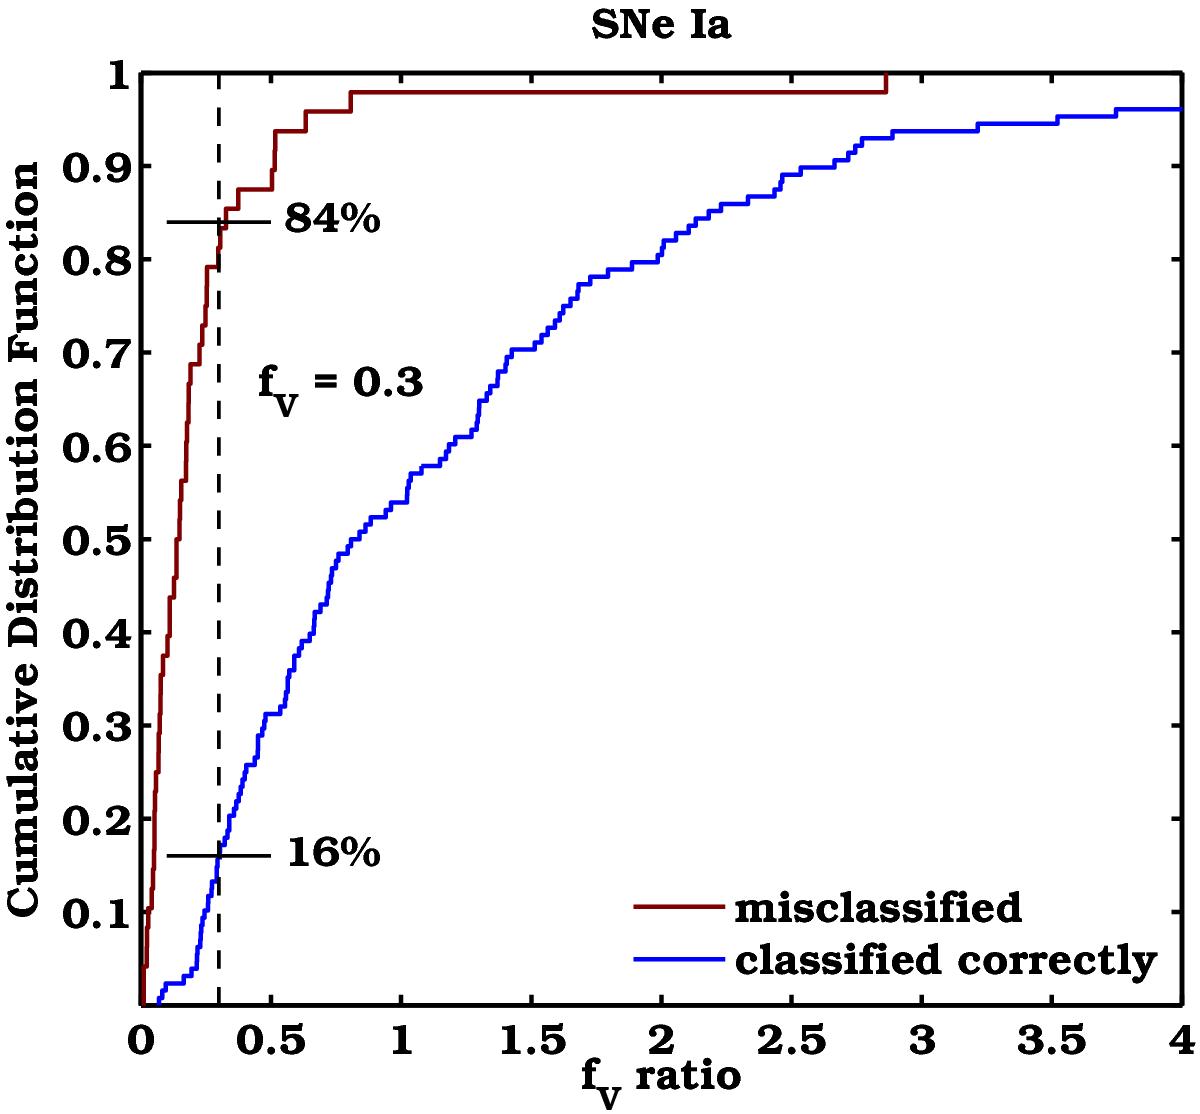
Distributions of simulated SNe Ia (normal) interacting with a CSM with respect to the flux ratio fV. The objects classified correctly have larger fV ratios and the two distributions are statistically different at a high significance (p ~ 10-15 in a KS test). All spectra that were given a Ia-CSM designation have been considered to be correctly classified. The dashed line indicates that less than 16% of the simulated events were correctly (wrongly) classified at flux ratios below (above) fV = 0.3.
Current usage metrics show cumulative count of Article Views (full-text article views including HTML views, PDF and ePub downloads, according to the available data) and Abstracts Views on Vision4Press platform.
Data correspond to usage on the plateform after 2015. The current usage metrics is available 48-96 hours after online publication and is updated daily on week days.
Initial download of the metrics may take a while.