Fig. 3
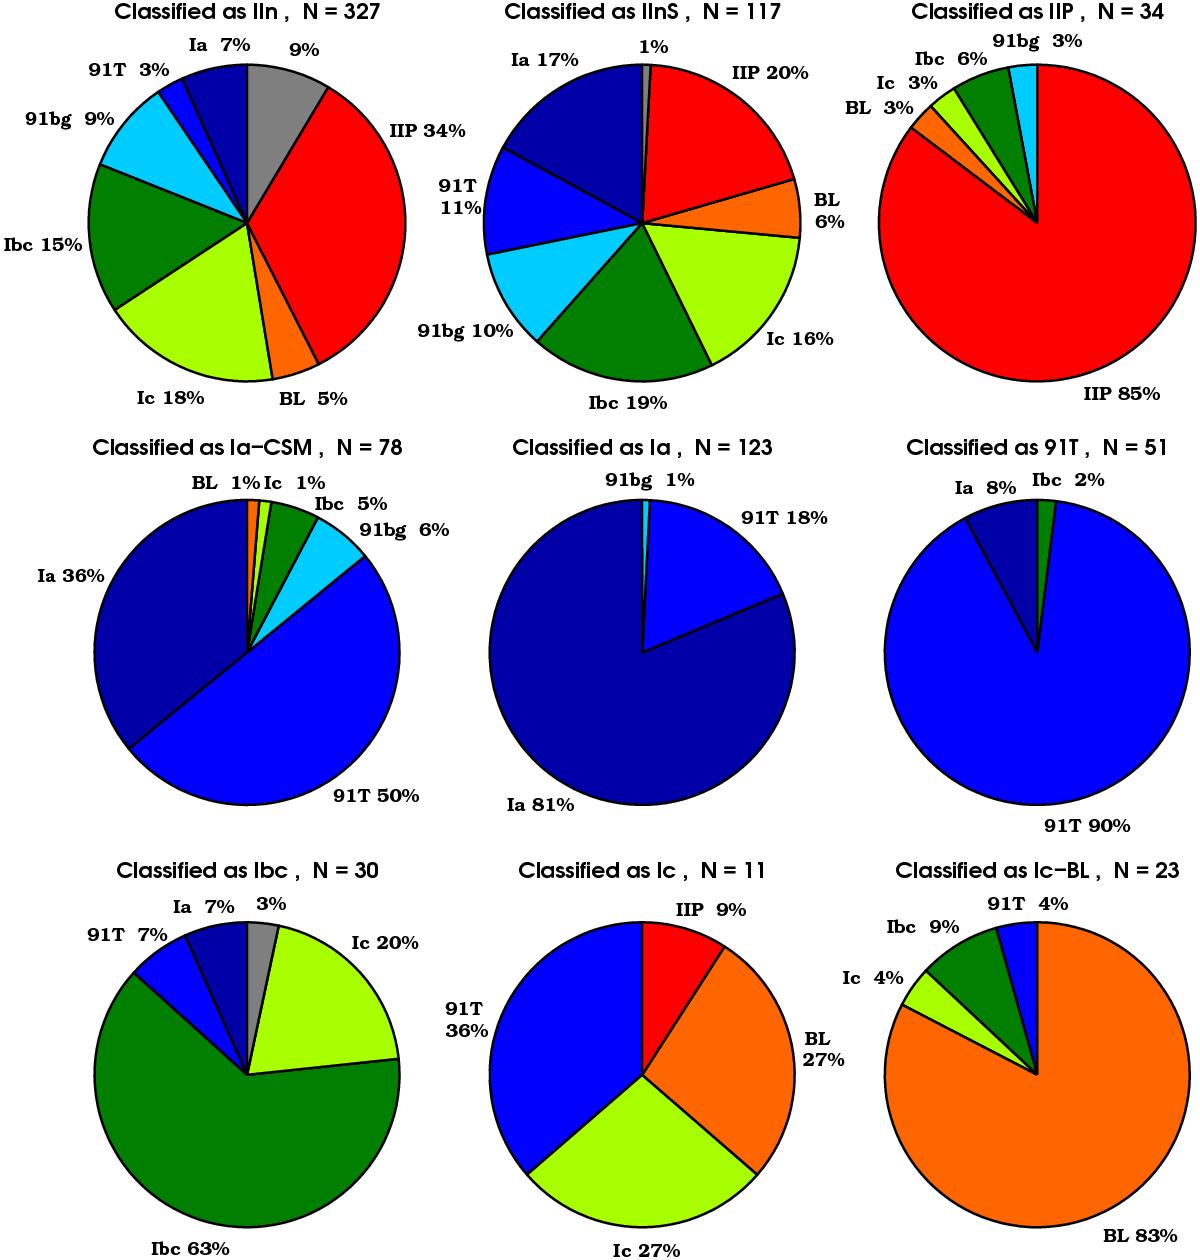
Pie charts showing the real nature of objects that were given a certain classification. The number of spectra is indicated above the pie charts. All percentages have been rounded to the closest integer. The first row shows the distribution of the input SN templates for spectra that were classified as IIn, IInS, and IIP, respectively. The second row shows the same for all spectra that were typed as thermonuclear. No pie chart is shown for the events classified as 91bg-like. Five simulated events were classified as such and the underlying SN was indeed 91bg-like in all cases. The third row shows the real nature of the SNe that were typed as various stripped core-collapse SNe. The contamination from core-collapse SNe in the spectra classified as thermonuclear reached 7% in the Ia-CSM pie, with one more stripped event classified as 91T-like. Up to 14% of the objects classified as stripped core-collapse explosions were really thermonuclear, with the contamination being lower for Ic-BL and higher for SNe Ic. The grey colour indicates simulated spectra where no SN template was included. As expected, most of these were classified as IIn.
Current usage metrics show cumulative count of Article Views (full-text article views including HTML views, PDF and ePub downloads, according to the available data) and Abstracts Views on Vision4Press platform.
Data correspond to usage on the plateform after 2015. The current usage metrics is available 48-96 hours after online publication and is updated daily on week days.
Initial download of the metrics may take a while.