Fig. 2
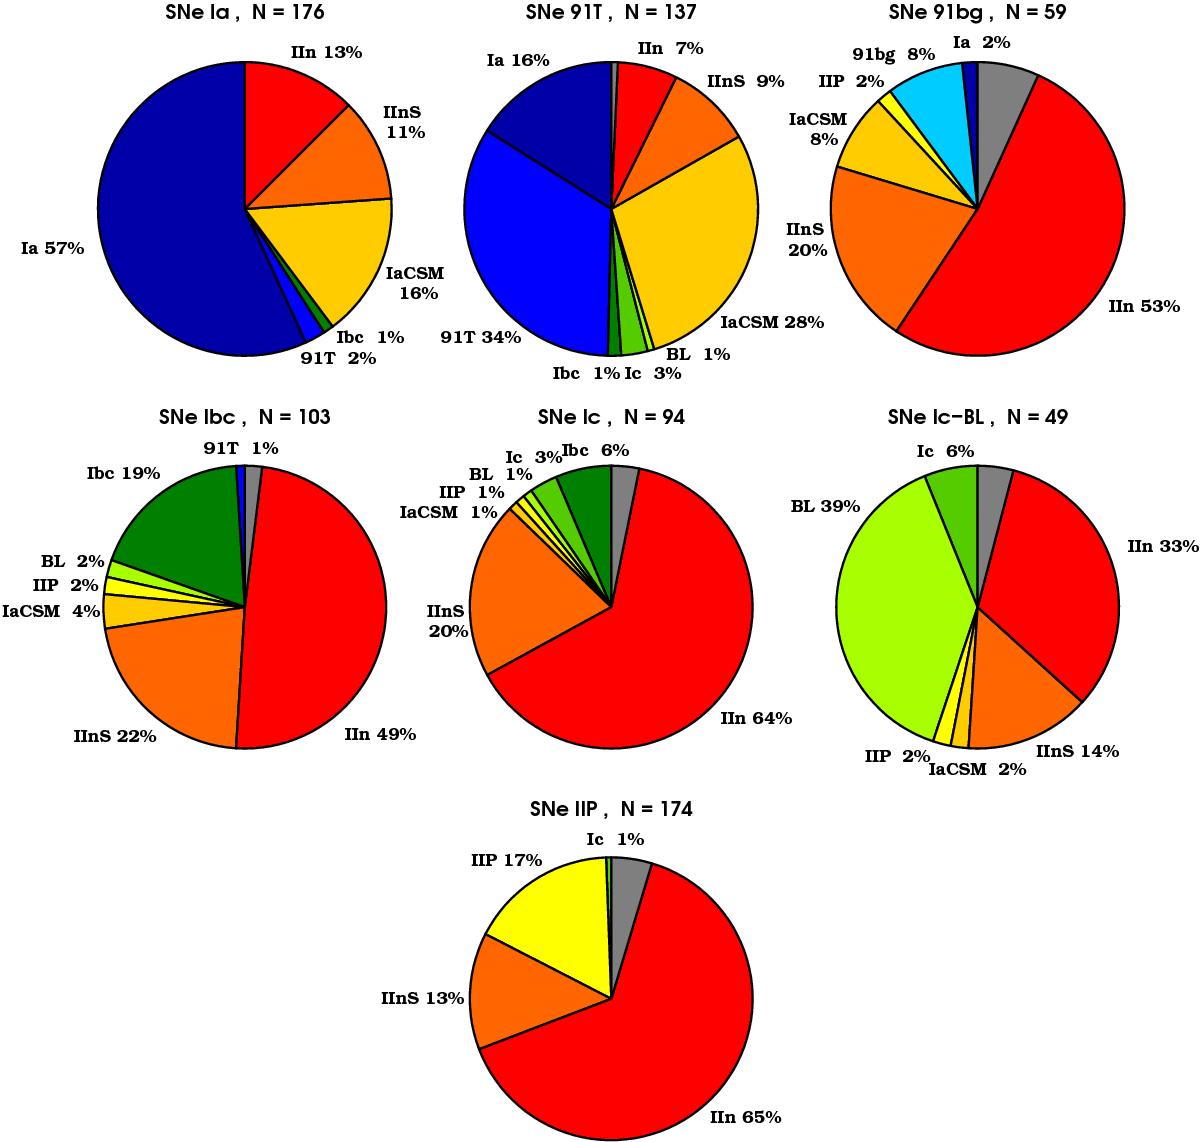
Pie charts for each spectral type that was used as input to the simulation (Ia-normal, 91T, 91bg, Ibc, Ic, Ic-BL, and IIP) and showing how these were typed by the human classifiers. The total number of simulated spectra per spectral type is indicated above the pie charts. All percentages have been rounded to the closest integer. In addition to the seven input types, the following classifications were allowed: Ia-CSM, IInS, and IIn (see Sect. 3). The grey colour corresponds to a few SNe that were classified as “none”. The recovery rate is higher among bright SNe. Fainter sub-types are more often classified as SNe IIn (including IInS). See text for more details.
Current usage metrics show cumulative count of Article Views (full-text article views including HTML views, PDF and ePub downloads, according to the available data) and Abstracts Views on Vision4Press platform.
Data correspond to usage on the plateform after 2015. The current usage metrics is available 48-96 hours after online publication and is updated daily on week days.
Initial download of the metrics may take a while.