Fig. 13
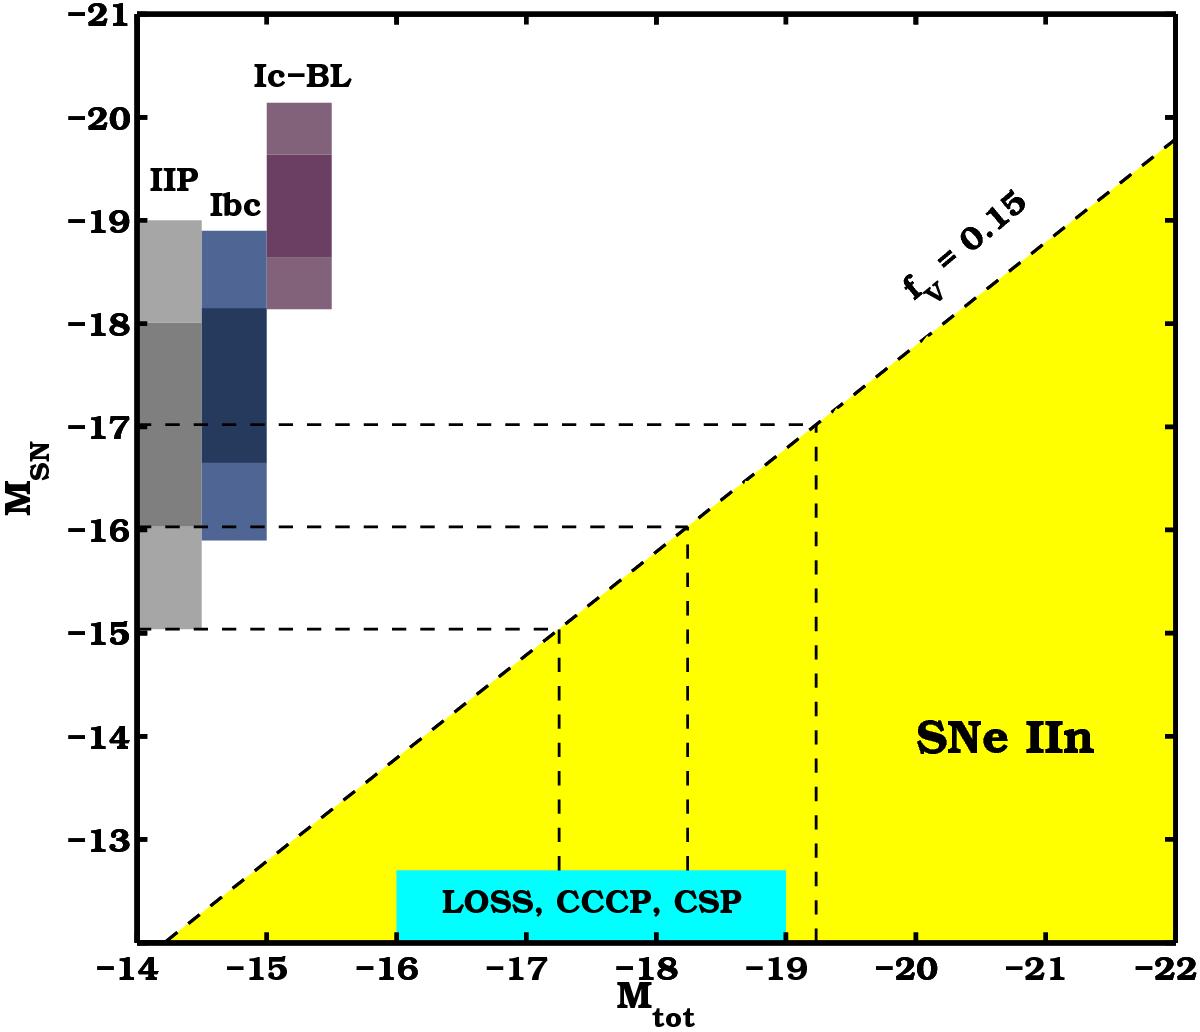
Maximum luminosity of a SN below strong CSM interaction as a function of the resulting total luminosity and the ratio fV. SNe that are classified as IIn are found in the region fV< 0.15 (yellow-coloured area; limit best suited for IIP-CSM) and there is a corresponding upper limit in the maximum luminosity of the underlying transient. The luminosity range for most well-studied samples of SNe IIn is indicated by the cyan colour. LOSS, CCCP, and CSP stand for the samples of Li et al. (2011b), Kiewe et al. (2012) and Taddia et al. (2013), respectively. 1σ and 2σ contours for the luminosity functions of the core-collapse SNe adopted here are shown as vertical bars. A few horizontal and vertical dashed lines are drawn to guide the eye. It is shown that the faintest (M ≳ −17.2) SNe IIn cannot hide a SN IIP that is brighter than M = −15.
Current usage metrics show cumulative count of Article Views (full-text article views including HTML views, PDF and ePub downloads, according to the available data) and Abstracts Views on Vision4Press platform.
Data correspond to usage on the plateform after 2015. The current usage metrics is available 48-96 hours after online publication and is updated daily on week days.
Initial download of the metrics may take a while.