Fig. 12
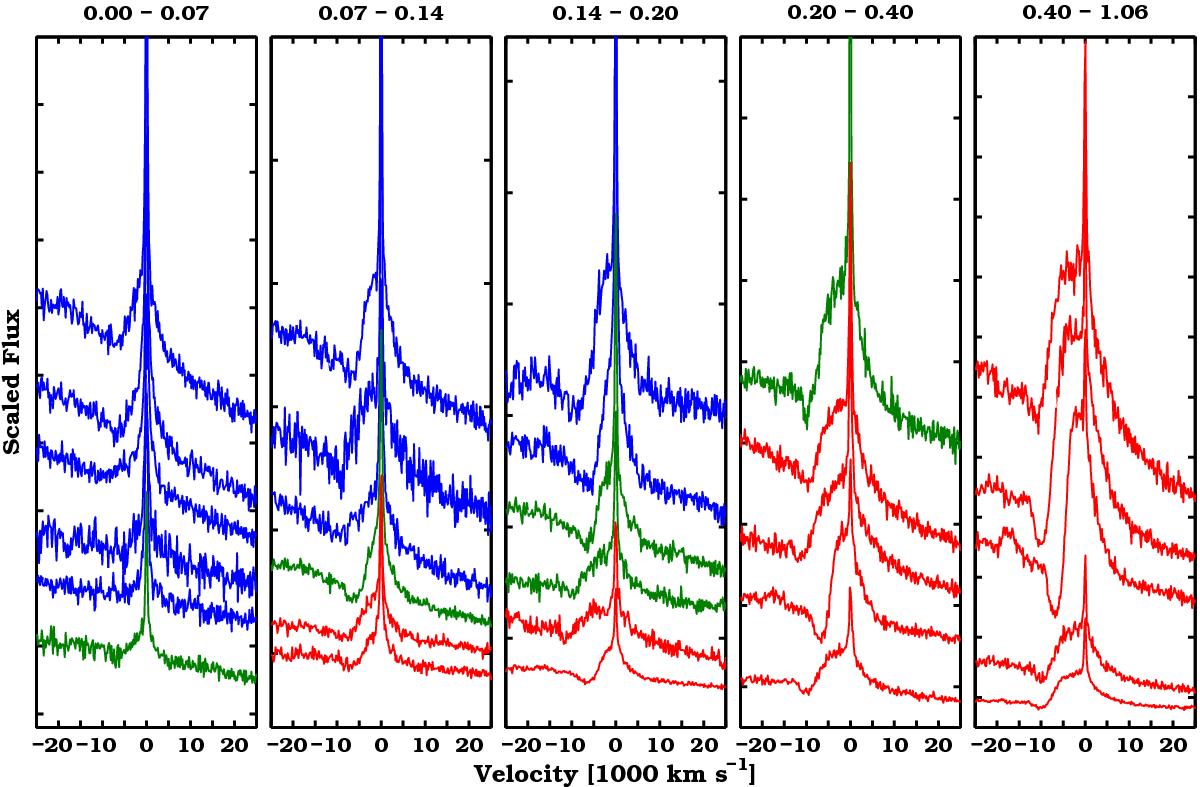
Representative velocity profiles of the Hα lines of SNe IIP-CSM for different values of the ratio fV. The range of each fV bin is shown above each panel. The spectra are coloured depending on the classification they received in this project: blue for Type IIn, green for Type IInS, and red for Type IIP. As the relative SN contribution increases, the Hα lines become broader, more asymmetric and the absorption component of the P-Cygni profile appears. The flux of the spectra has been scaled for presentation purposes.
Current usage metrics show cumulative count of Article Views (full-text article views including HTML views, PDF and ePub downloads, according to the available data) and Abstracts Views on Vision4Press platform.
Data correspond to usage on the plateform after 2015. The current usage metrics is available 48-96 hours after online publication and is updated daily on week days.
Initial download of the metrics may take a while.