Fig. 11
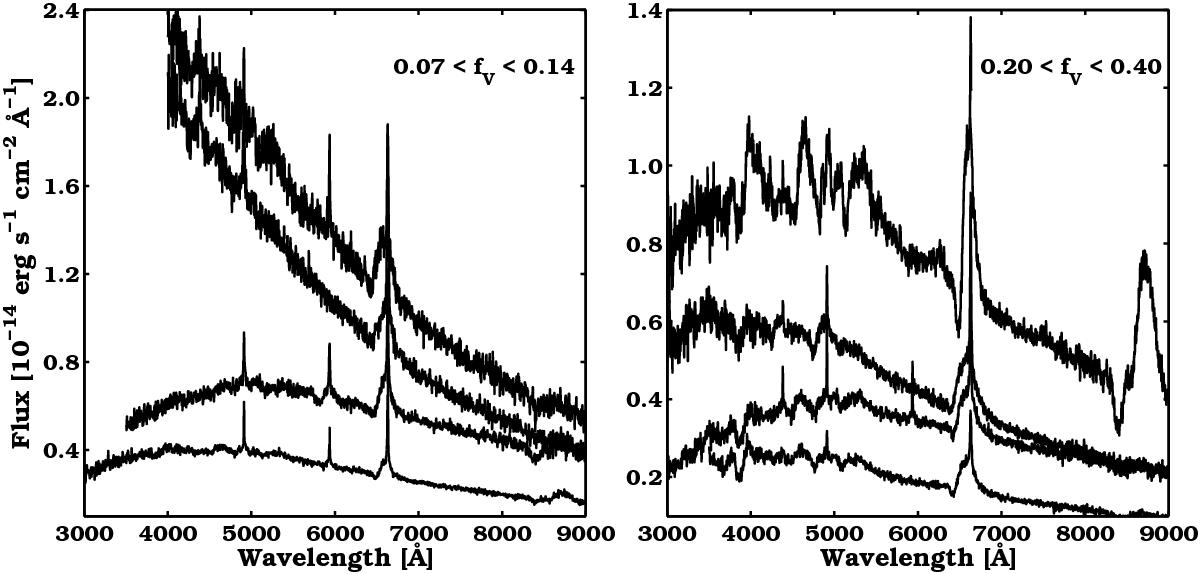
Example spectra of SNe IIP interacting with a CSM from our MC simulation. Left: spectra with a flux ratio fV between 0.07 and 0.14. Right: spectra with 0.2 <fV< 0.4. The spectra span a range of phases, MSN, AV, TBB , and other simulation parameters. The spectra to the right show more features and different Hα profiles than those to the left. The spectra have not been scaled.
Current usage metrics show cumulative count of Article Views (full-text article views including HTML views, PDF and ePub downloads, according to the available data) and Abstracts Views on Vision4Press platform.
Data correspond to usage on the plateform after 2015. The current usage metrics is available 48-96 hours after online publication and is updated daily on week days.
Initial download of the metrics may take a while.