Fig. 1
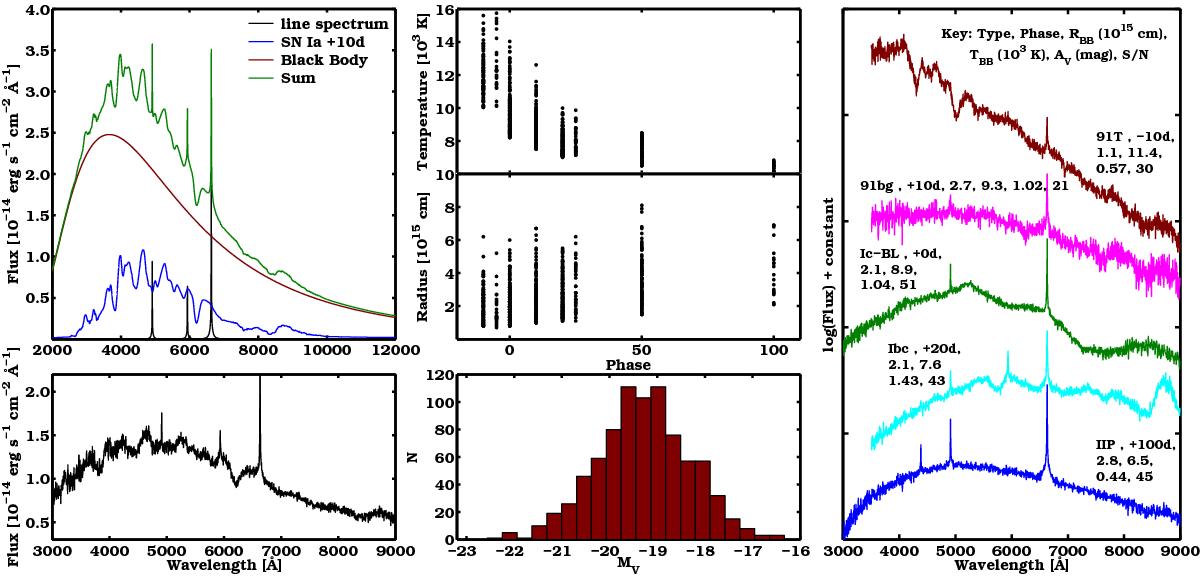
Left panels: top figure: procedure of spectral composition in our MC simulations for an example case. The composite spectrum is the sum of a SN template (here a SN Ia at +10d), a BB continuum (here RBB = 3.2 × 1015 cm and TBB = 8000 K), and an emission line spectrum. Bottom panel: we reddened the composite spectrum (by a total AV = 0.66 mag) and added noise (here S/N = 40) to obtain the final spectrum in the (maximum) wavelength range 3000−9000 Å. All fluxes are shown in the absolute scale. Middle panels: the black-body radii and temperatures that were used in the MC simulation as a function of phase. Bottom panel: histogram of the resulting distribution of absolute magnitudes MV. The obtained values range from −22.5 to −16 and nicely overlap with the observed dispersion in SN IIn luminosities. Right panel: more example spectra taken from the final MC simulation and spanning a wide distribution of underlying SN types, phases, BB continuum strength, total extinction, and S/N. The values for these parameters are noted next to the spectra. The CSM contamination affects the spectral appearance. The spectra are shown in a logarithmic scale and have been shifted by arbitrary constants for presentation purposes.
Current usage metrics show cumulative count of Article Views (full-text article views including HTML views, PDF and ePub downloads, according to the available data) and Abstracts Views on Vision4Press platform.
Data correspond to usage on the plateform after 2015. The current usage metrics is available 48-96 hours after online publication and is updated daily on week days.
Initial download of the metrics may take a while.