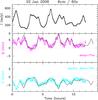
Fig. 8
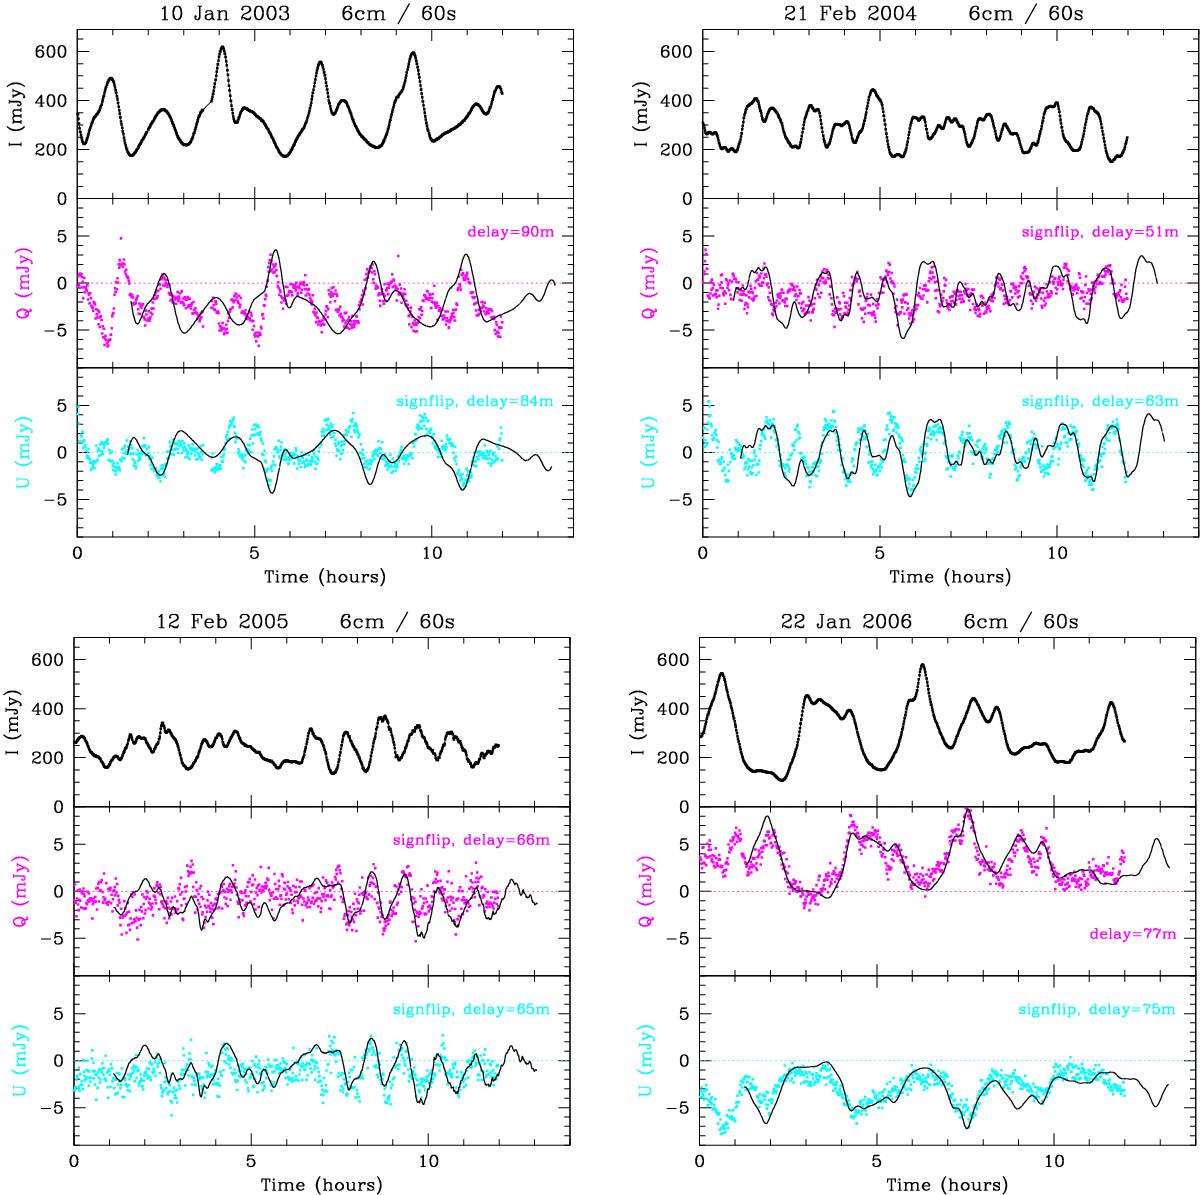
Variations in I, Q, and U in J1819+3845 over a succession of years. Each panel shows lightcurves for Stokes I, Q and U. Typical errors are as described in Fig. 7, but about 1.4× smaller due to the increased integration time (60 s as against 30 s). Each epoch was chosen to represent a similar stage in the annual cycle of timescale variations exhibited by the source, facilitating meaningful comparison between epochs. The thin black curves in each of the Q and U panels show a scaled and shifted version of the Stokes I lightcurve for comparison.
Current usage metrics show cumulative count of Article Views (full-text article views including HTML views, PDF and ePub downloads, according to the available data) and Abstracts Views on Vision4Press platform.
Data correspond to usage on the plateform after 2015. The current usage metrics is available 48-96 hours after online publication and is updated daily on week days.
Initial download of the metrics may take a while.