Fig. 7
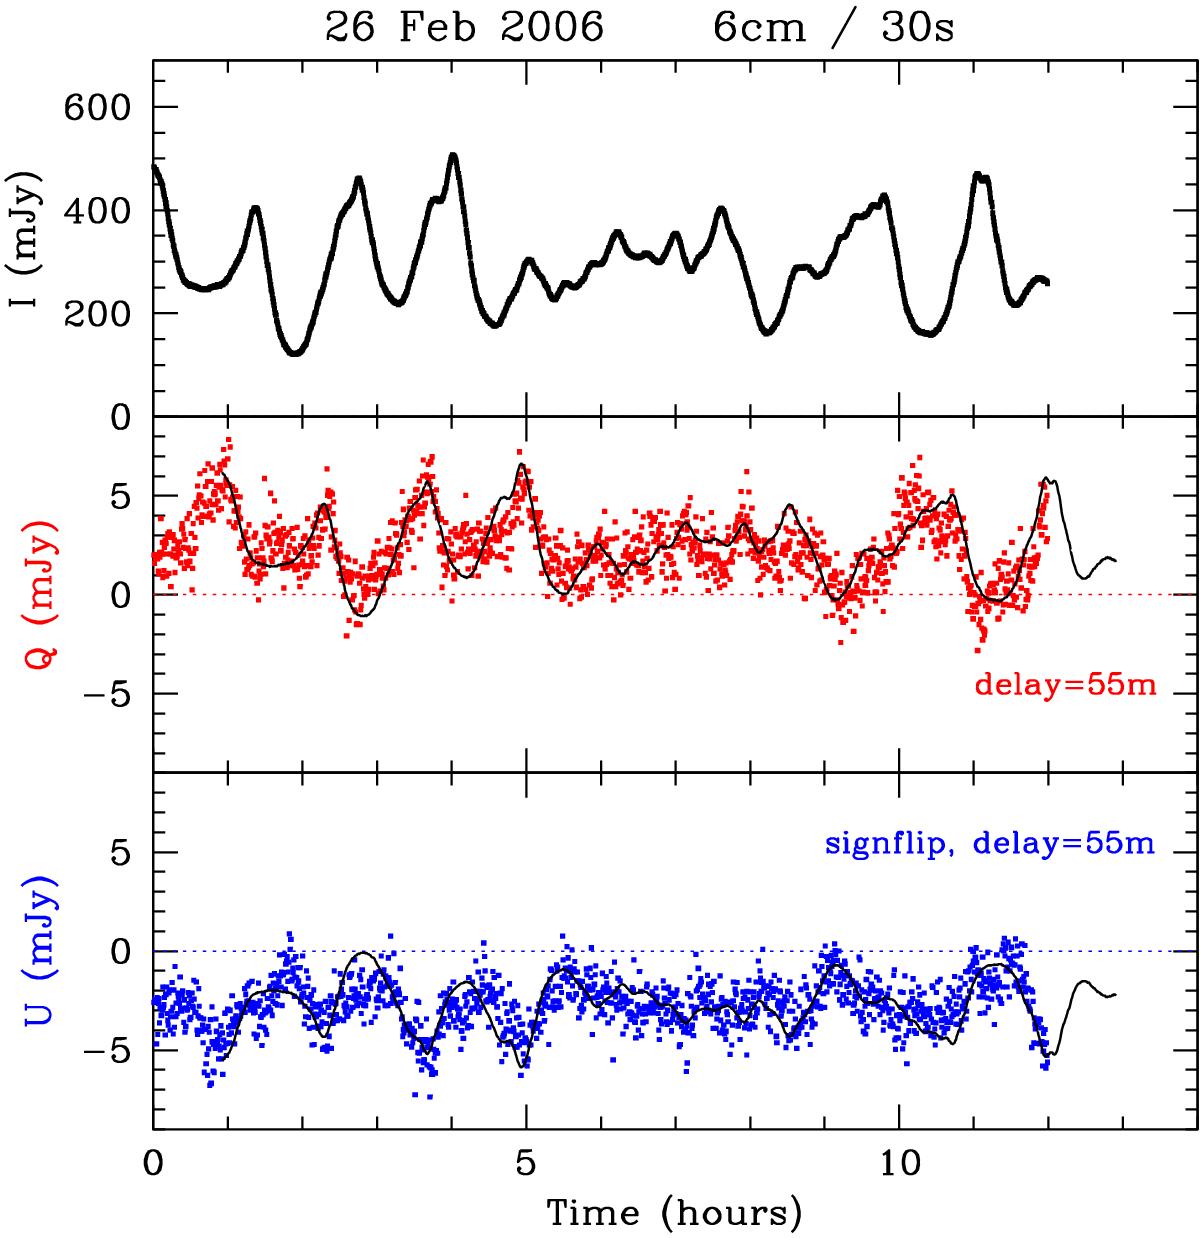
A demonstration of the strong correlation between polarized and unpolarized emission. The polarized emission lags the unpolarized emission, indicating that the centroid of the polarized emission is angularly offset from the bulk of the unpolarized source emission. At this particular epoch, 26 February 2006, the delay was about 55 min and similar for both Stokes Q and U. A typical noise uncertainty after 30 s integration on the I, Q, and U data points is about 1.5 mJy. This is less than the width of the lightcurve for Stokes I. To create a flux density-scaled Stokes I lightcurve, overplotted on the Stokes Q and U lightcurves, we subtracted the 12 h averaged total flux density, multiplied the difference by a scale factor, typically 0.015–0.03, and added the average flux of the relevant Stokes parameter as presented in Fig. 6. The Stokes U signals have negative polarity on this epoch, hence we flipped the sign of the scaled and shifted Stokes I signals. In this plot the data were averaged to a timescale of 30 s.
Current usage metrics show cumulative count of Article Views (full-text article views including HTML views, PDF and ePub downloads, according to the available data) and Abstracts Views on Vision4Press platform.
Data correspond to usage on the plateform after 2015. The current usage metrics is available 48-96 hours after online publication and is updated daily on week days.
Initial download of the metrics may take a while.