Fig. 6
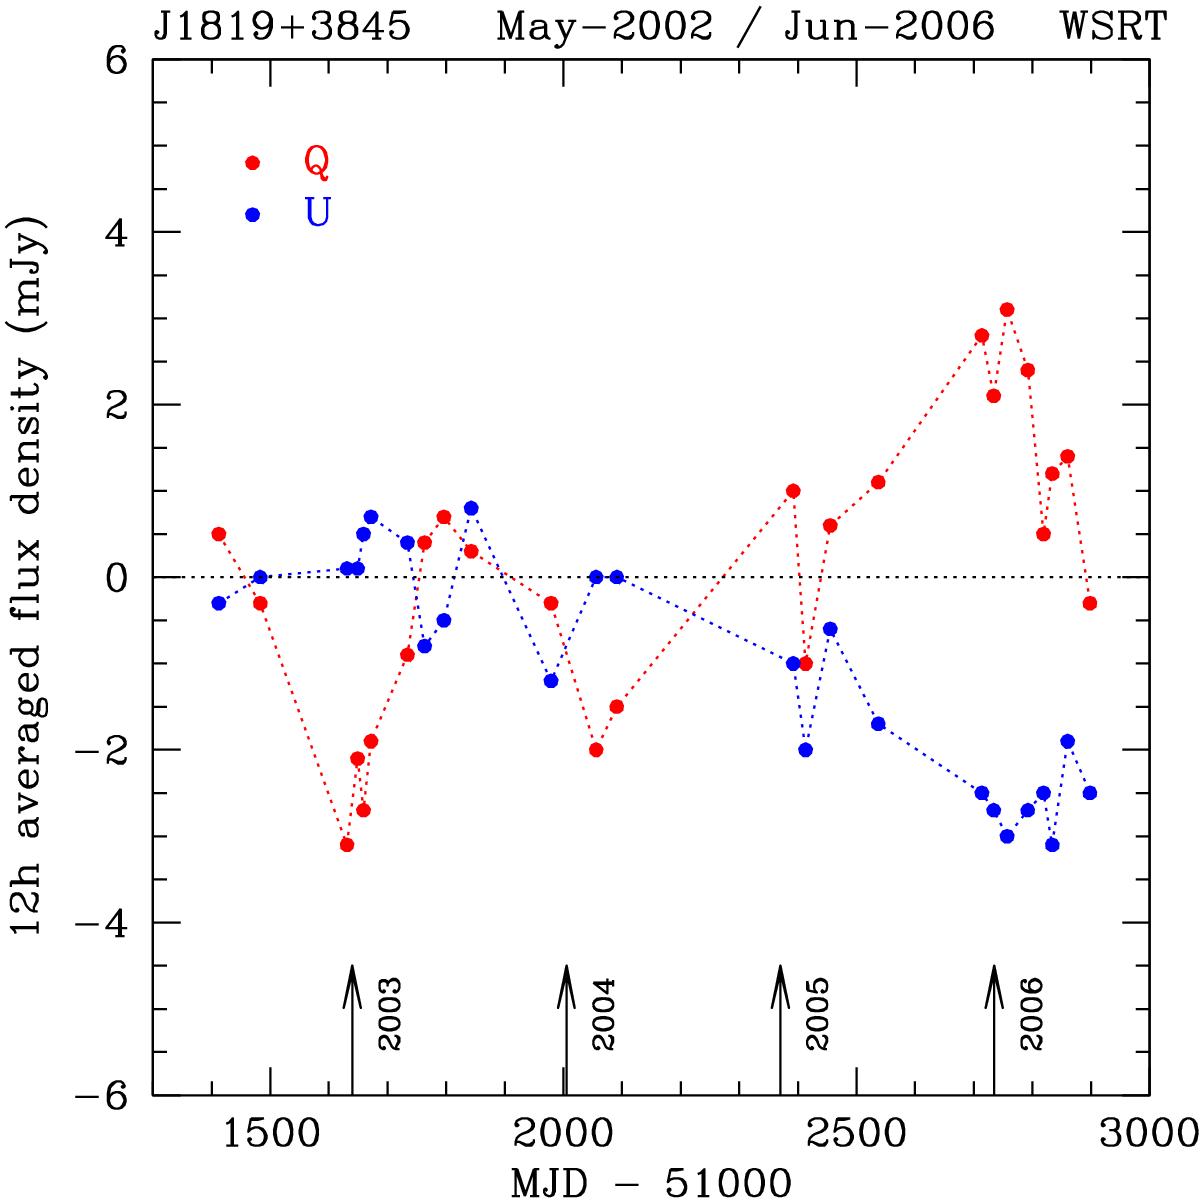
Long-term evolution of the flux density of Stokes Q and U, for twenty-five, 6 cm 12 h syntheses taken in the period from May 2002 to June 2006. The plotted values are averaged over (mostly) 12 h tracks; the peak values in Q and U often reach values of ±5−7 mJy. The uncertainty on the data points is mostly due to calibration errors and the thermal noise error after 12 h averaging is less than 0.05 mJy. We estimate the uncertainty on Stokes U to typically be 0.1% of the Stokes I flux density or about 0.3 mJy. The uncertainty on Stokes Q is larger, about 0.25−0.5% of Stokes I, and this corresponds to about 0.75−1.5 mJy. These uncertainties are consistent with the short-term variations between the various epochs. Detailed lightcurves are shown in other figures.
Current usage metrics show cumulative count of Article Views (full-text article views including HTML views, PDF and ePub downloads, according to the available data) and Abstracts Views on Vision4Press platform.
Data correspond to usage on the plateform after 2015. The current usage metrics is available 48-96 hours after online publication and is updated daily on week days.
Initial download of the metrics may take a while.