Fig. 5
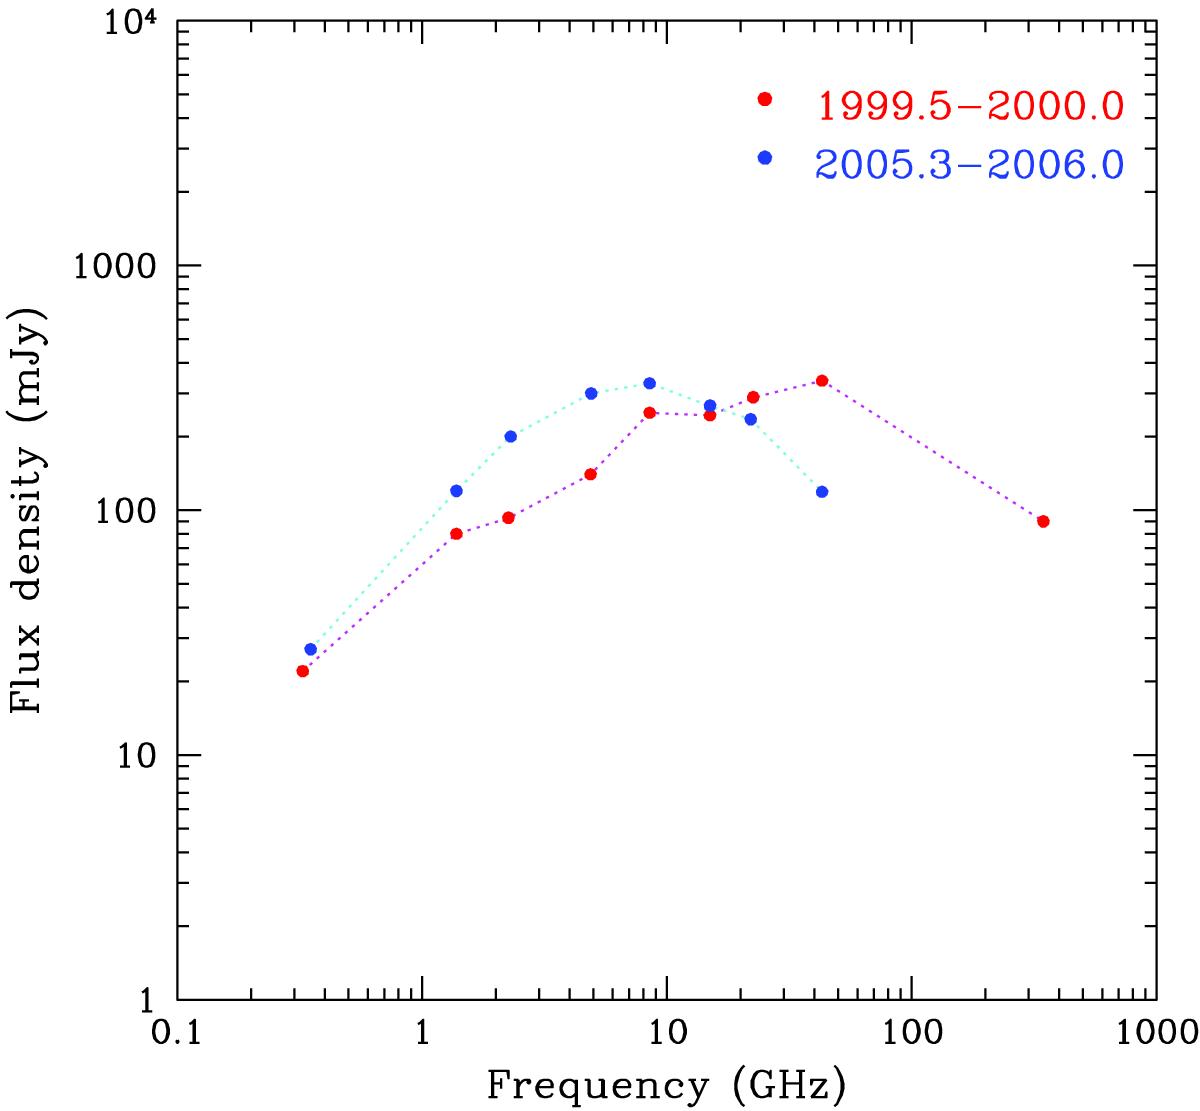
Broadband spectra of J1819+3845 for two epochs around 2000.0 and 2006.0. At most frequencies data at closely contemporaneous dates could be used. Data used in the construction of these spectra came from WSRT, VLA, VLBA, and JCMT observations presented in this paper, and from Moloney (2010, his Table 3.3, 8–43 GHz, VLBA). The lowest frequency data were taken in 1996 (92 cm) and 2005.3 (85 cm).The uncertainties on the data points are dominated by flux scale errors, which are typically a few per cent.
Current usage metrics show cumulative count of Article Views (full-text article views including HTML views, PDF and ePub downloads, according to the available data) and Abstracts Views on Vision4Press platform.
Data correspond to usage on the plateform after 2015. The current usage metrics is available 48-96 hours after online publication and is updated daily on week days.
Initial download of the metrics may take a while.