Fig. 14
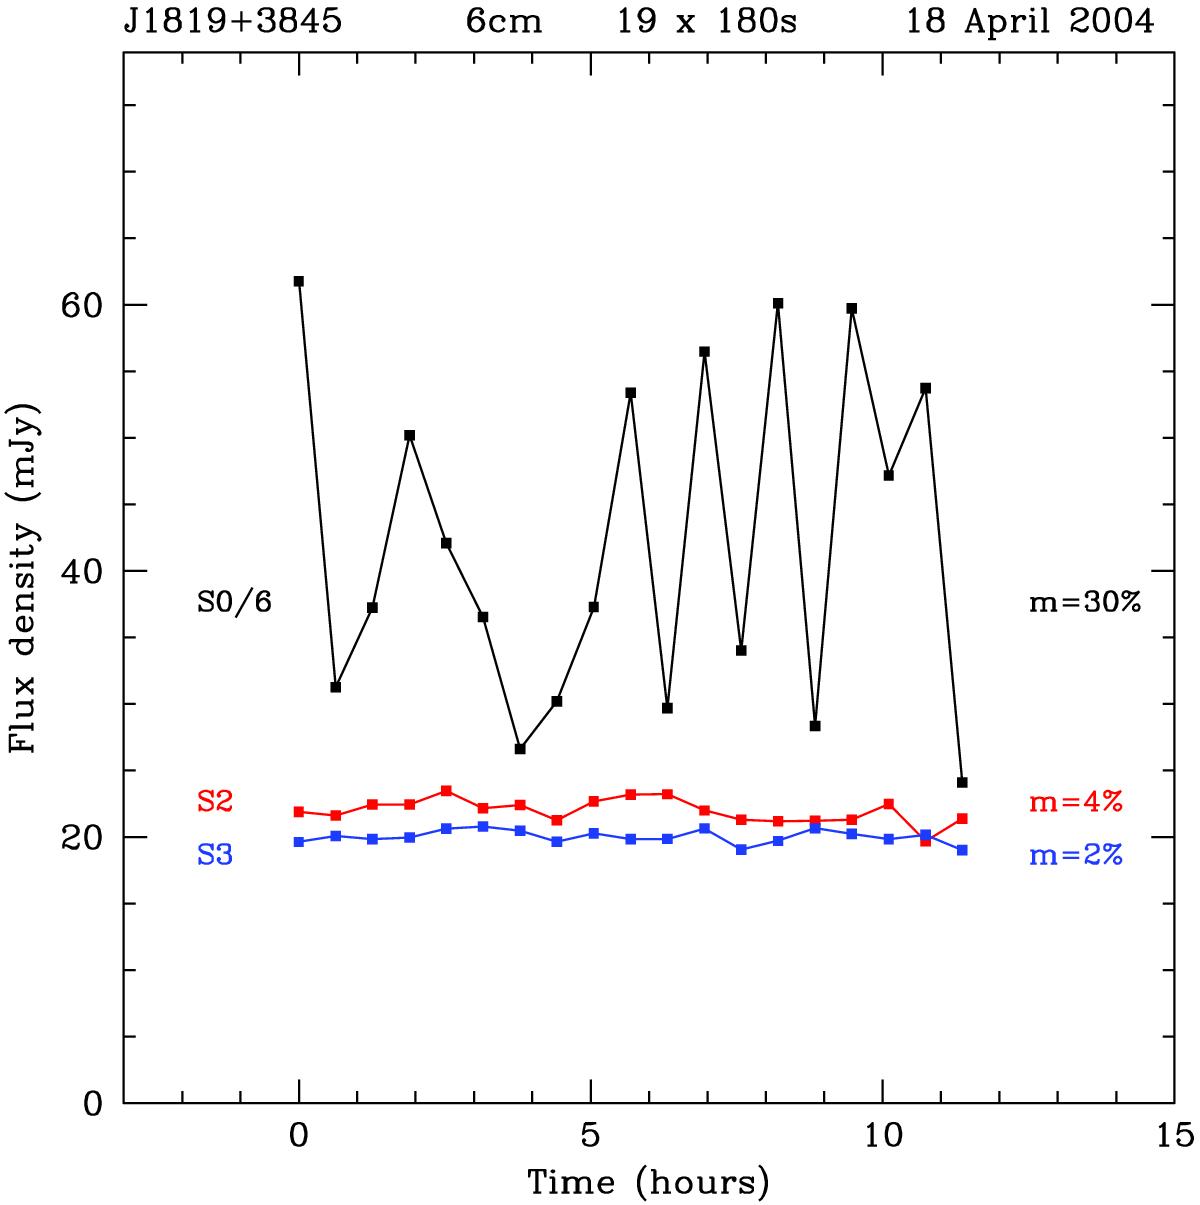
Lightcurves at 6 cm of the sources S2 and S3 on 18 Apr. 2004 shown with a scaled-down lightcurve of J1819+3845 (S0/6). The observed modulation indices for sources S2 and S3 shown on the right are consistent with a constant flux density during 12 h. By contrast, the observed variations in J1819+3845, with has a modulation index of 30%, are typical for the source in the fast season.
Current usage metrics show cumulative count of Article Views (full-text article views including HTML views, PDF and ePub downloads, according to the available data) and Abstracts Views on Vision4Press platform.
Data correspond to usage on the plateform after 2015. The current usage metrics is available 48-96 hours after online publication and is updated daily on week days.
Initial download of the metrics may take a while.