Fig. 13
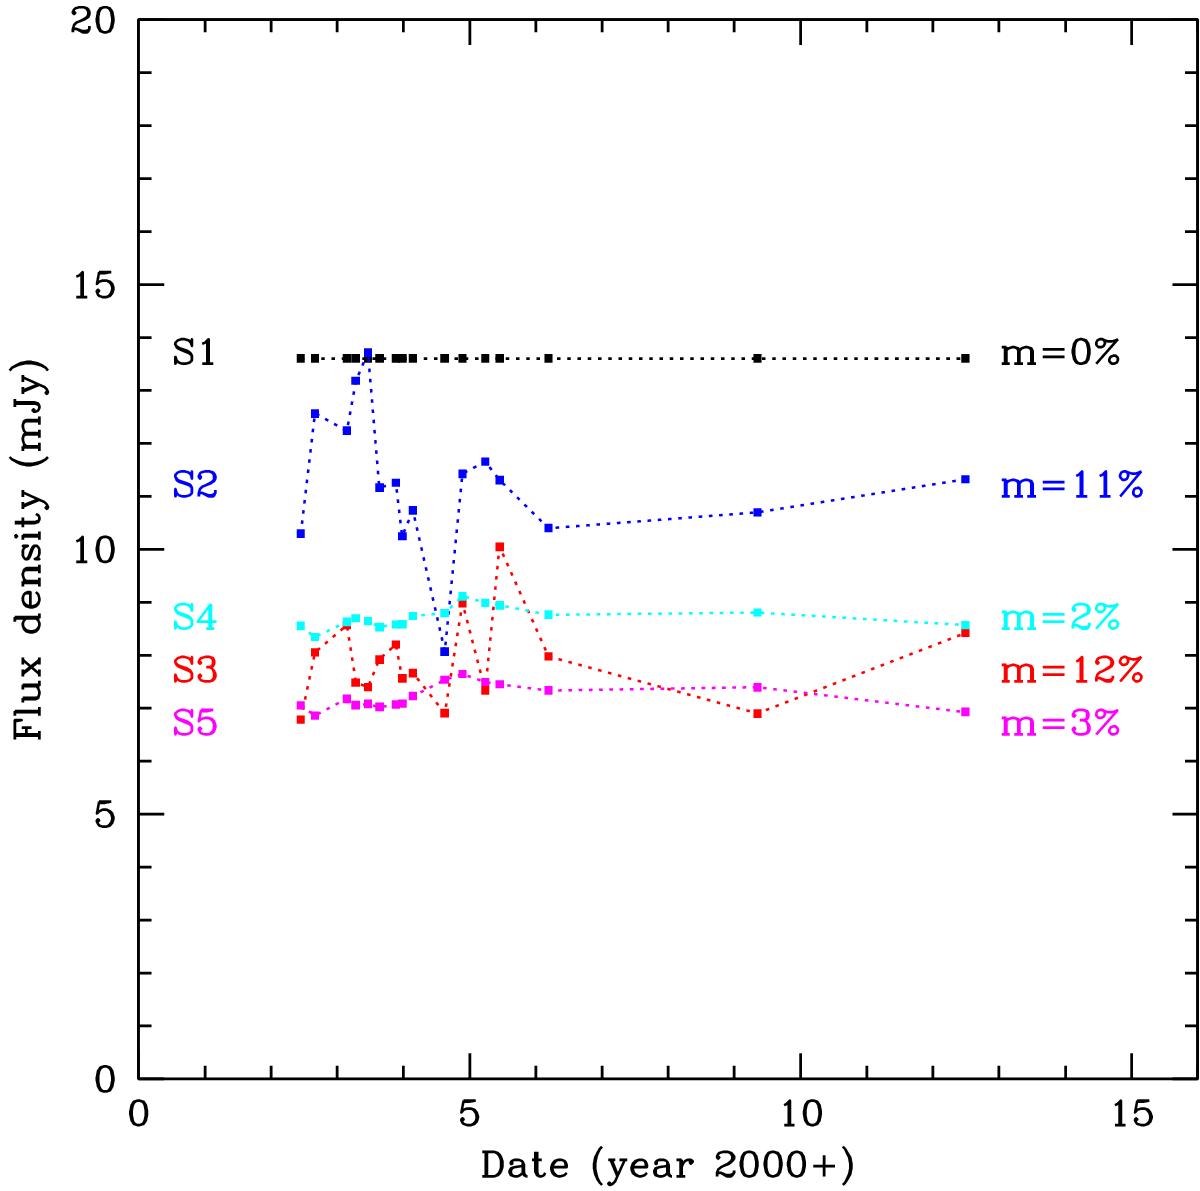
Lightcurves at 21 cm of the five brightest field sources in the 21 cm image shown in Fig. 12. The steep spectrum source S1 was used for flux normalization. The modulation indices of the sources are given on the right. The typical uncertainty on the flux densities for the various epochs is dominated by systematic errors, which are estimated to be about 2%. This implies that no believable variations have been detected in sources S4 and S5. All fluxes given are apparent fluxes, uncorrected for the primary beam.
Current usage metrics show cumulative count of Article Views (full-text article views including HTML views, PDF and ePub downloads, according to the available data) and Abstracts Views on Vision4Press platform.
Data correspond to usage on the plateform after 2015. The current usage metrics is available 48-96 hours after online publication and is updated daily on week days.
Initial download of the metrics may take a while.